Flowpay is a 5-month redesign of a SaaS financial operations platform used by mid-sized businesses.
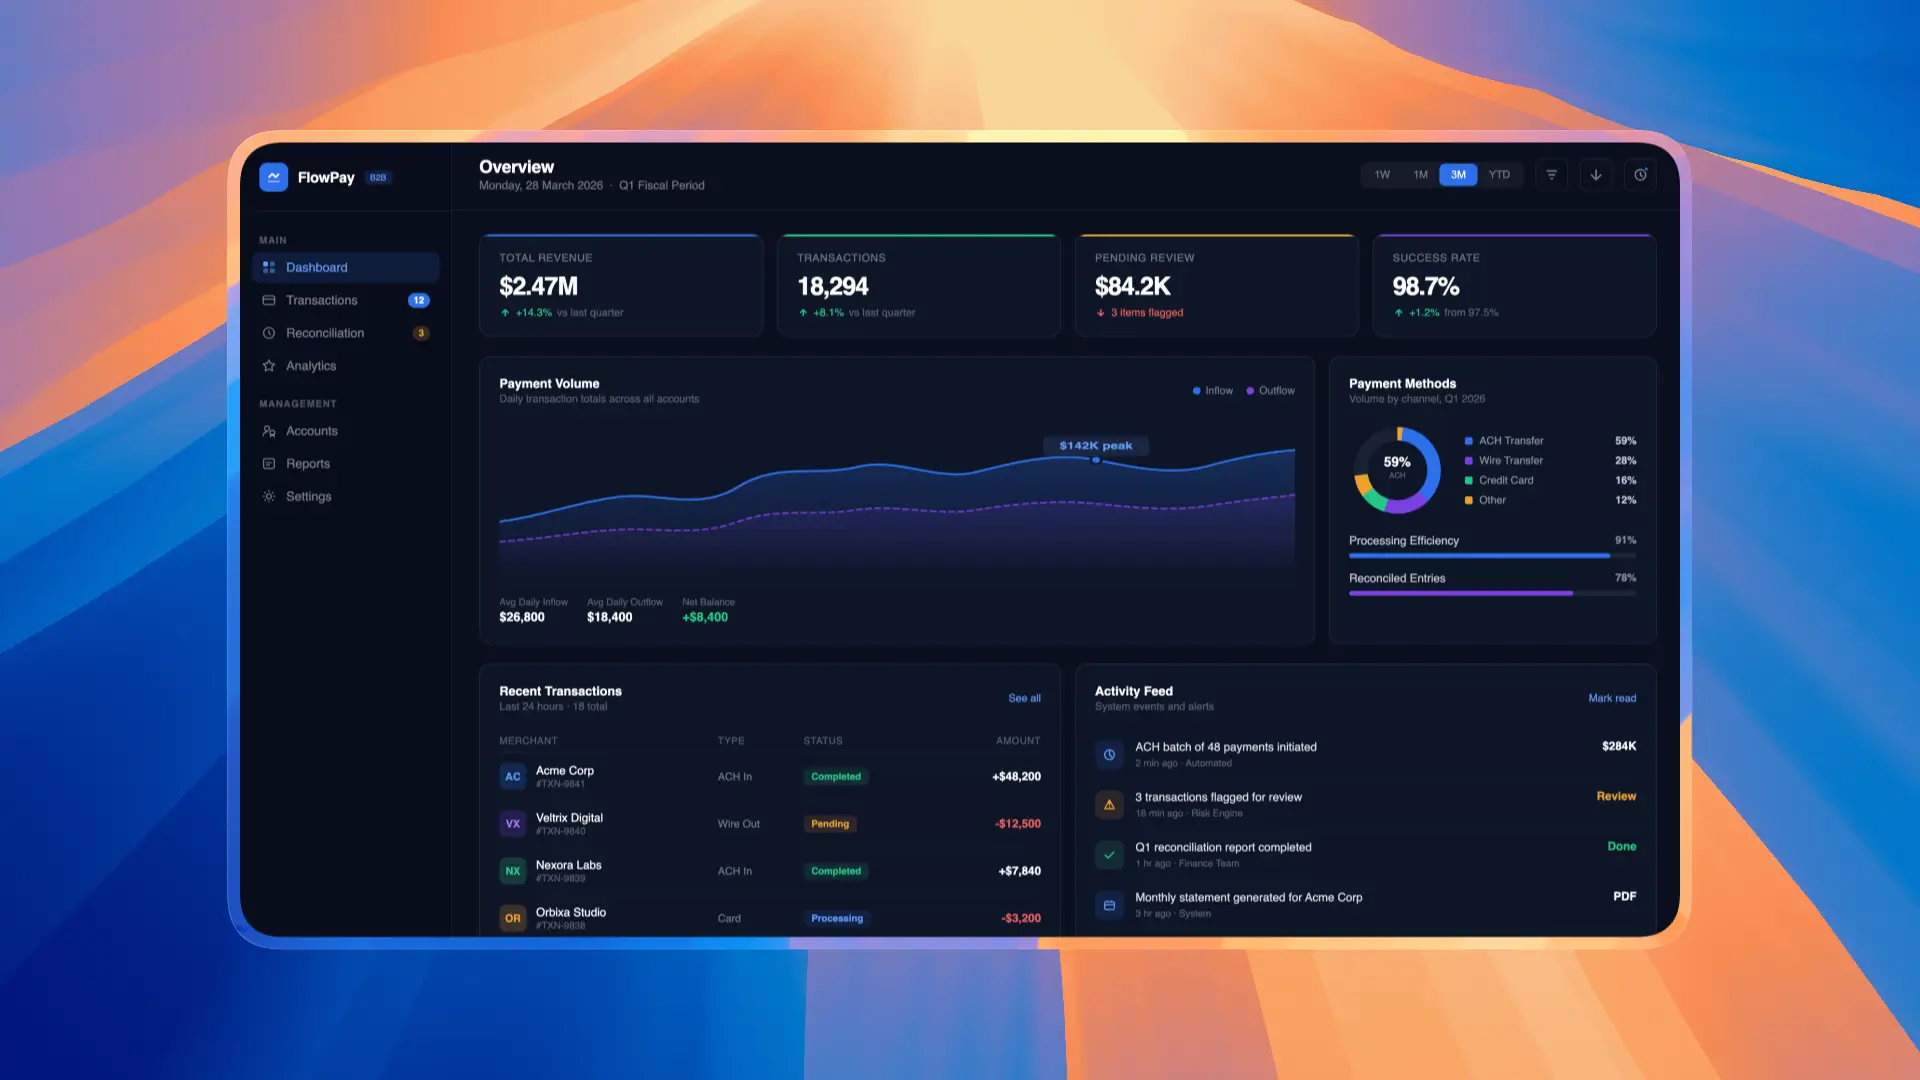
FlowPay is a B2B fintech platform serving 2,000+ businesses for cross-border payment processing. The existing dashboard was built 4 years ago and hadn’t kept pace with user needs or modern UX standards.
I was brought on as Lead Product Designer to redesign the entire payment dashboard experience — from transaction management to reporting — with the goal of reducing user friction and increasing platform engagement.
2,000+
Active Businesses
$50M+
Monthly Transactions
8
Team Members
FlowPay’s dashboard suffered from a 65% task abandonment rate during payment processing. Users were struggling with a cluttered interface, confusing navigation, and a 7-step payment flow that felt overwhelming — especially on mobile devices.
70% of abandonments happened during the payment creation flow
Mobile users spent 40% more time completing tasks than desktop users
First-time users were 3x more likely to contact support
NPS score had dropped from 42 to 28 over the past year
Competitors with simpler flows were gaining market share
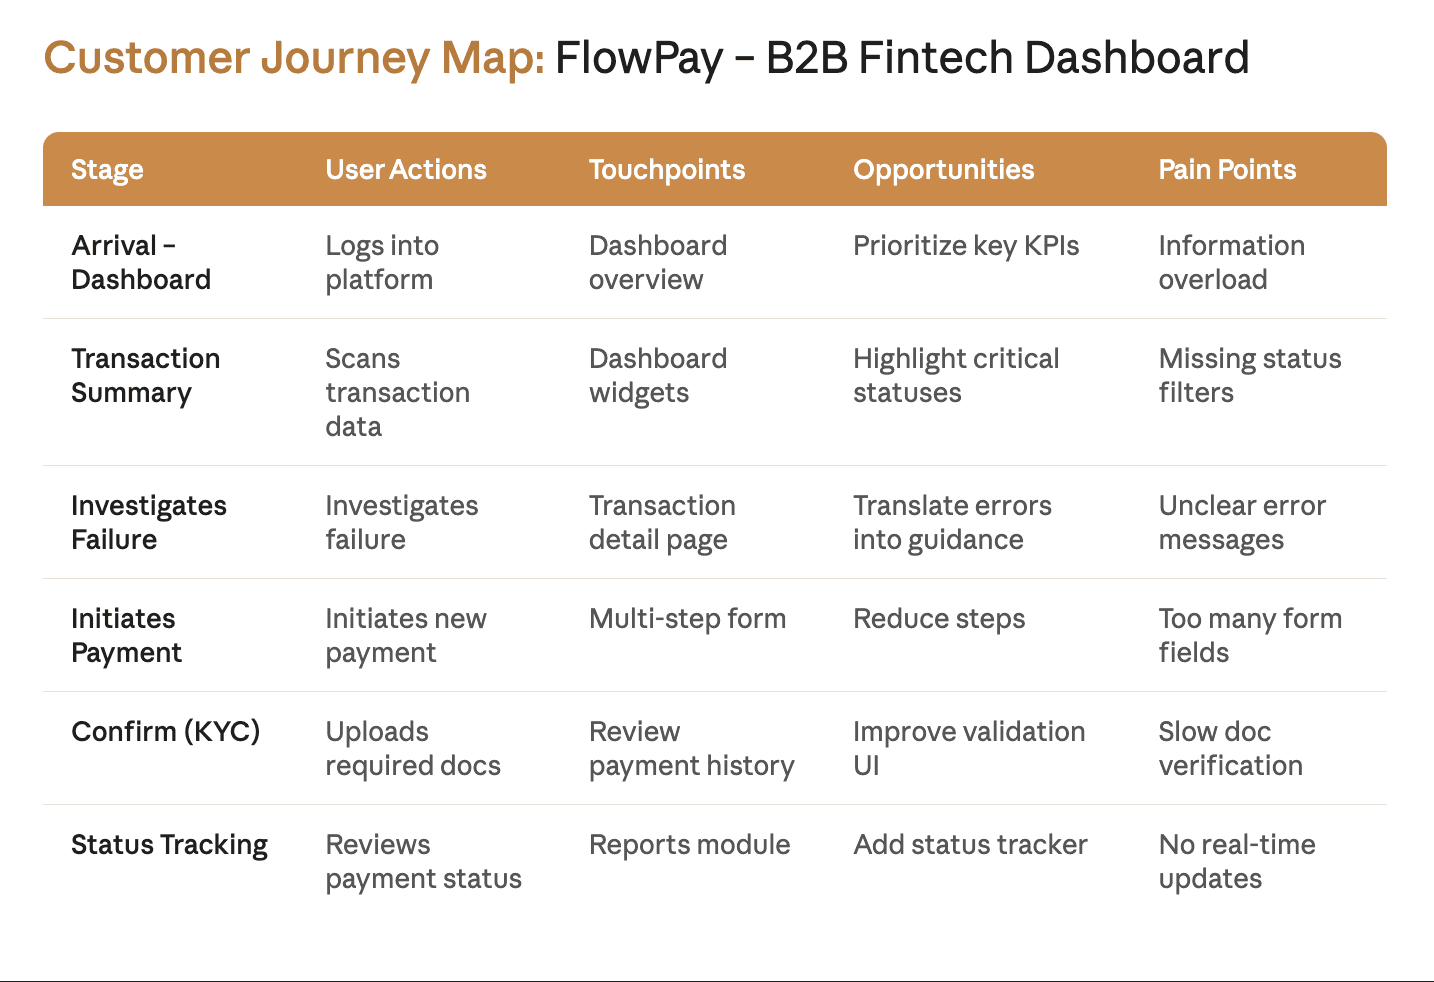
Armed with research insights, I facilitated a 2-day design sprint with the cross-functional team. We used crazy eights, mind mapping, and dot voting to generate and prioritize solutions.
From 120+ rough concepts, we narrowed down to 3 directions and ultimately chose “StreamFlow” — a concept that reimagined the payment creation flow as a guided, contextual experience rather than a rigid step-by-step form.
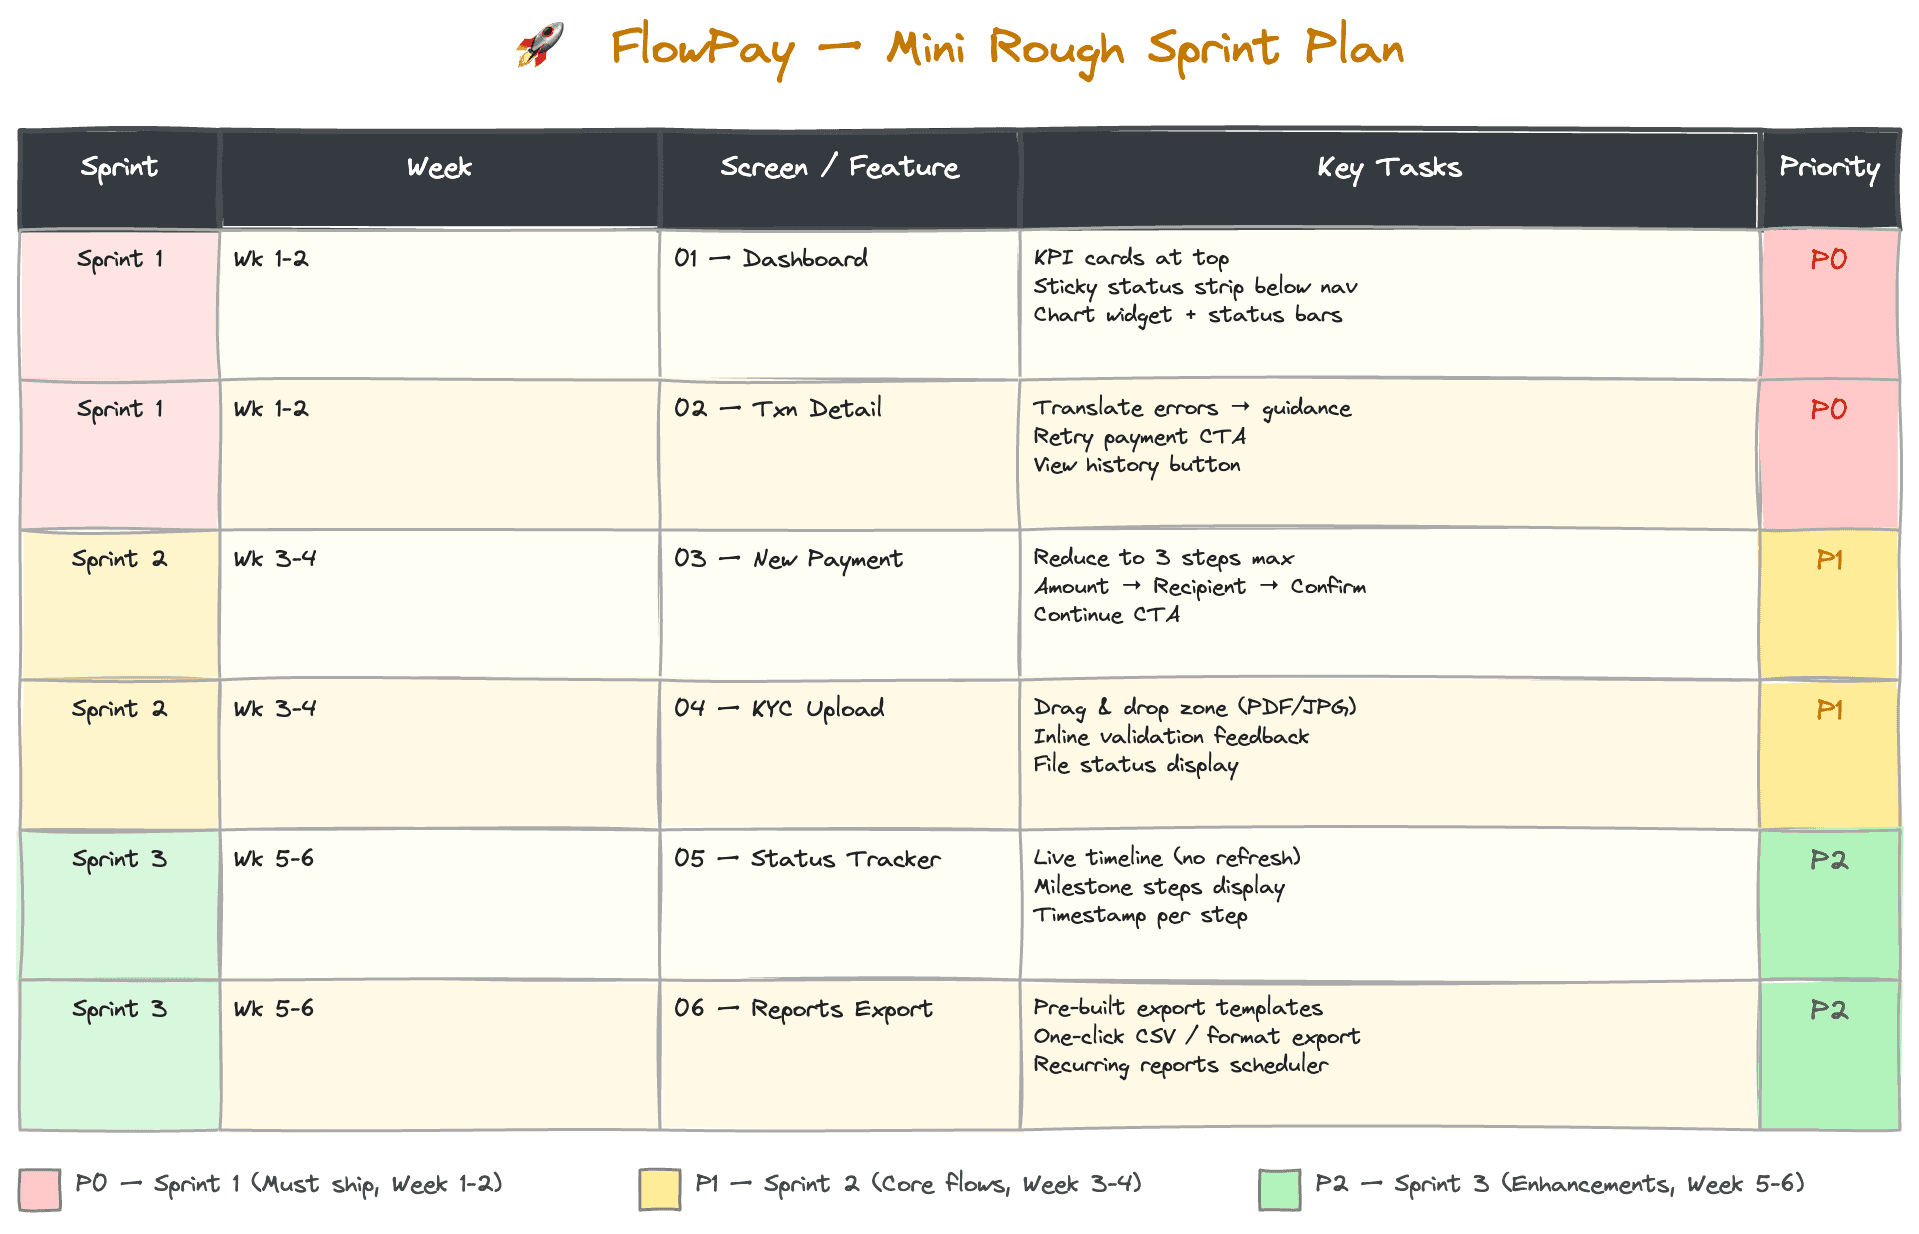
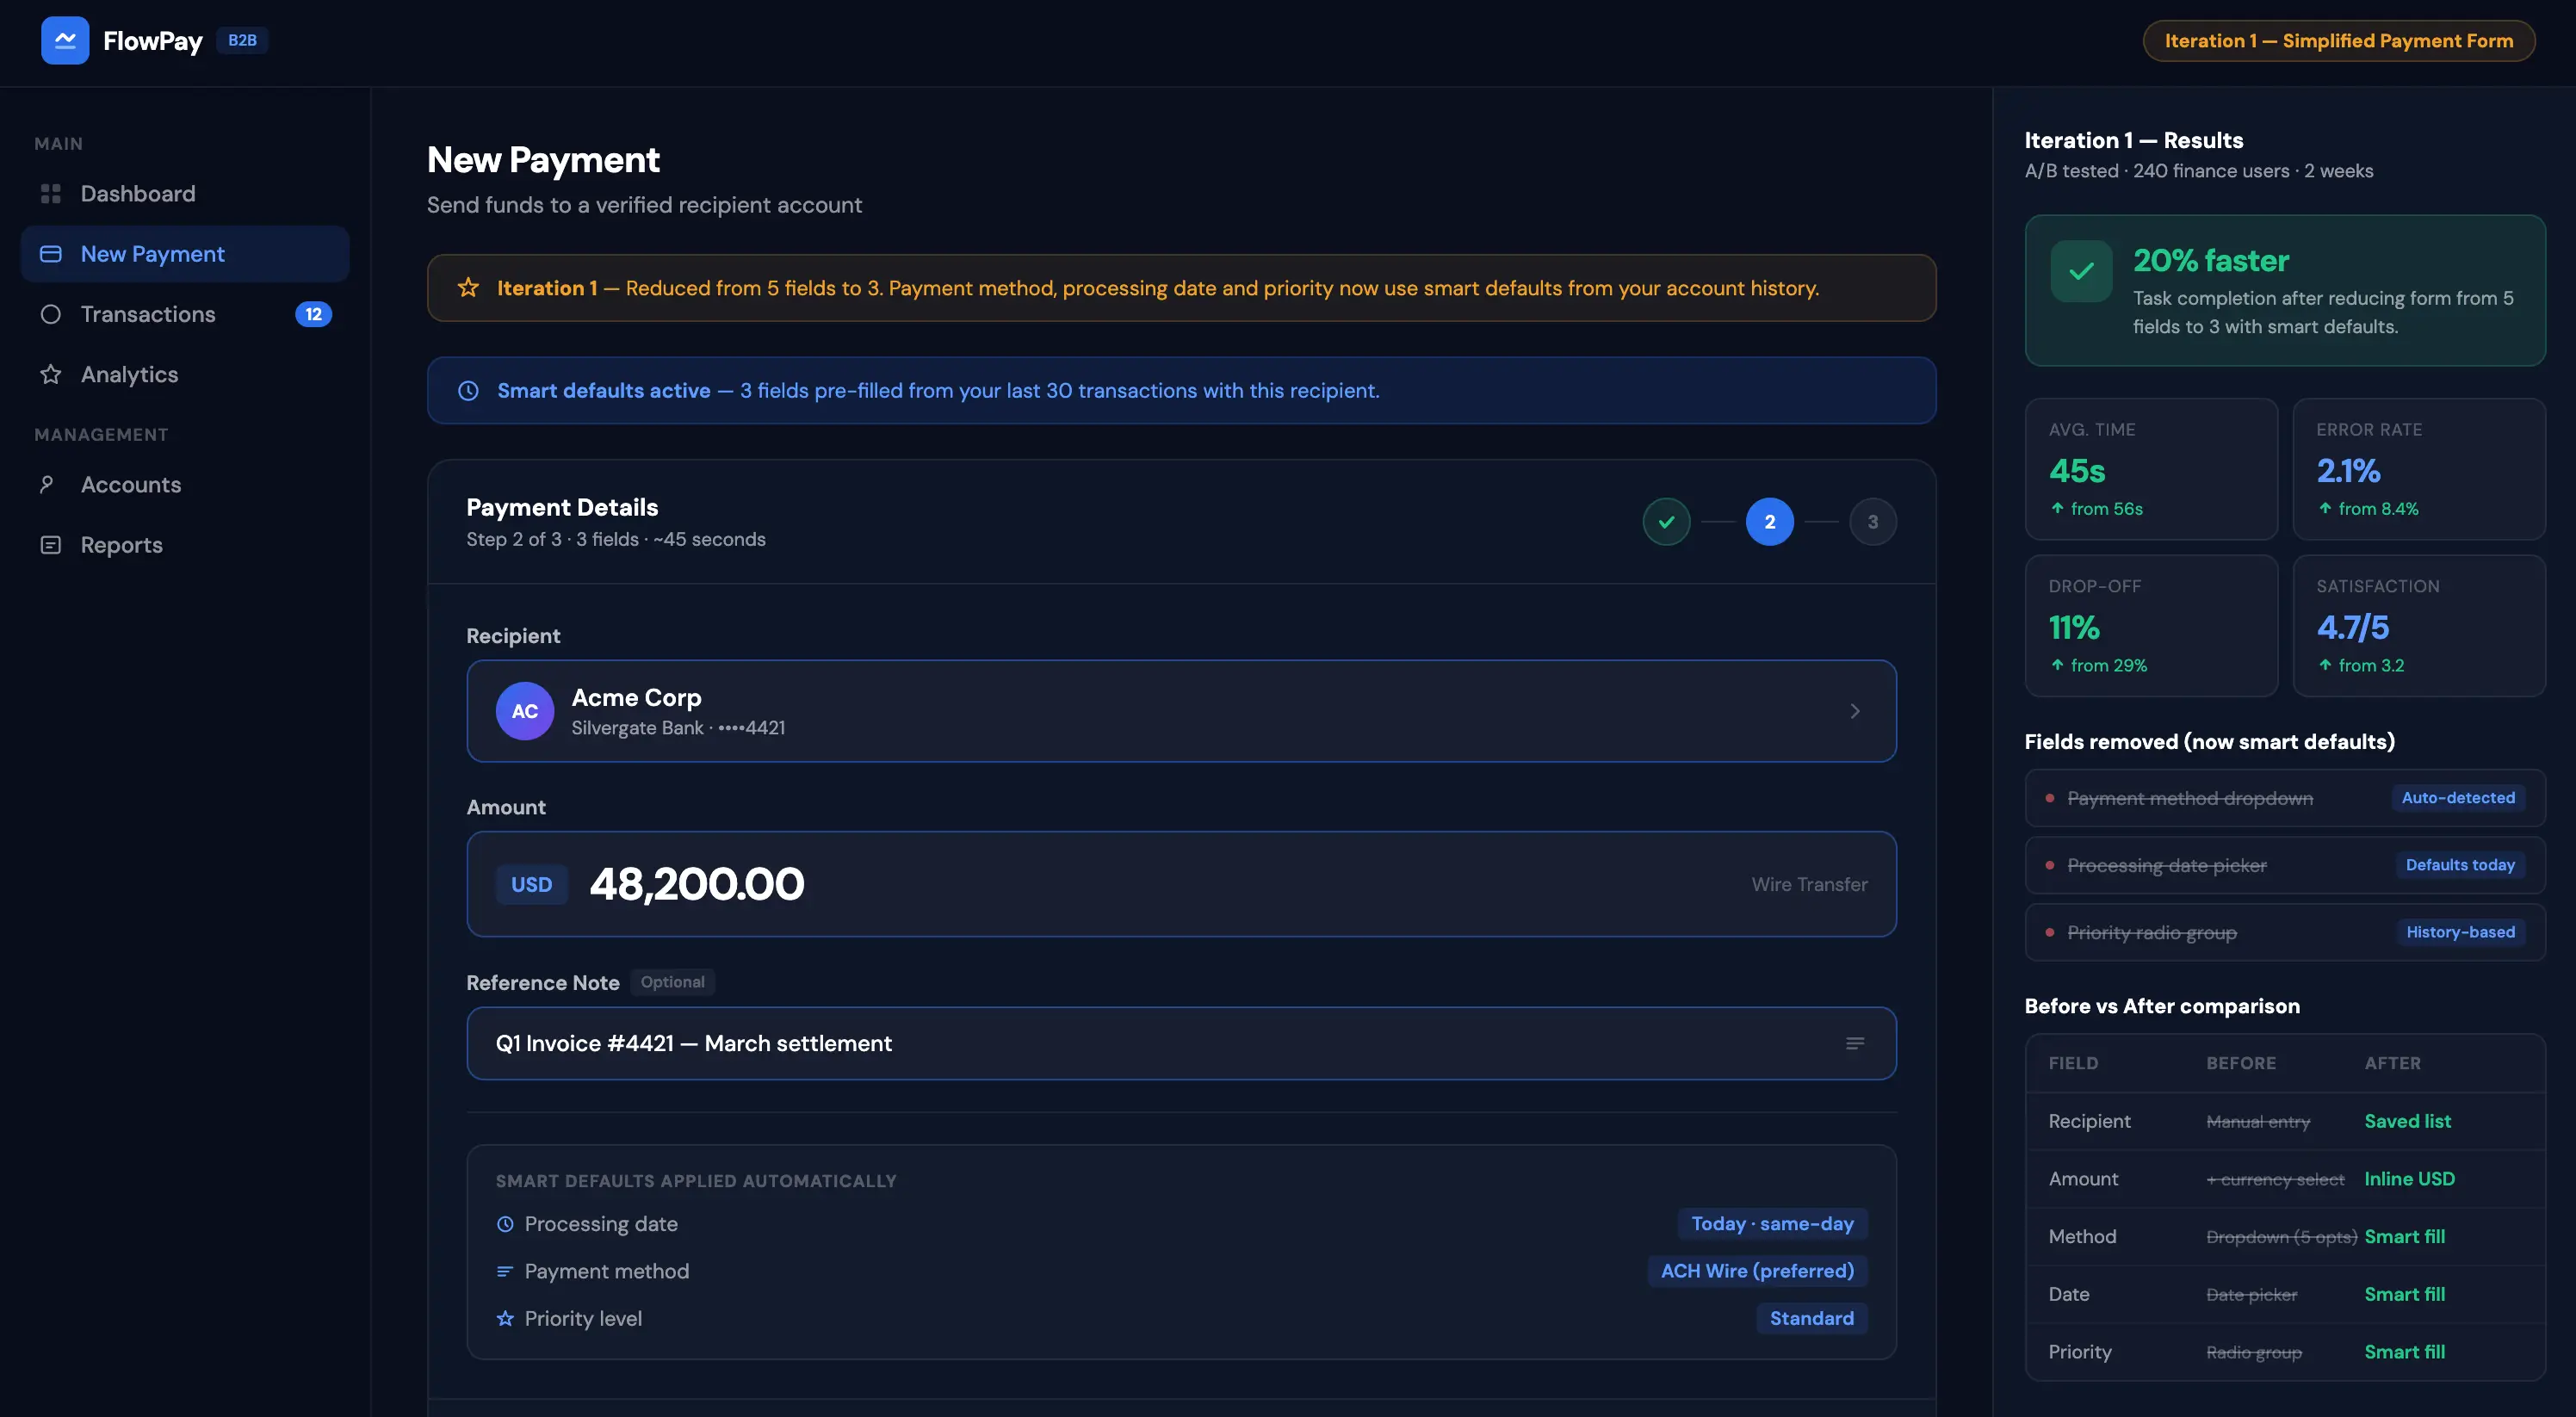
I mapped the complete user journey from login to payment confirmation. The primary goal was reducing the payment flow from 7 steps to 3 while maintaining all necessary compliance and verification requirements.
Payment details — smart defaults and auto-fill based on history
Review & confirm — all info on one screen with inline editing
Confirmation — real-time status with estimated processing time
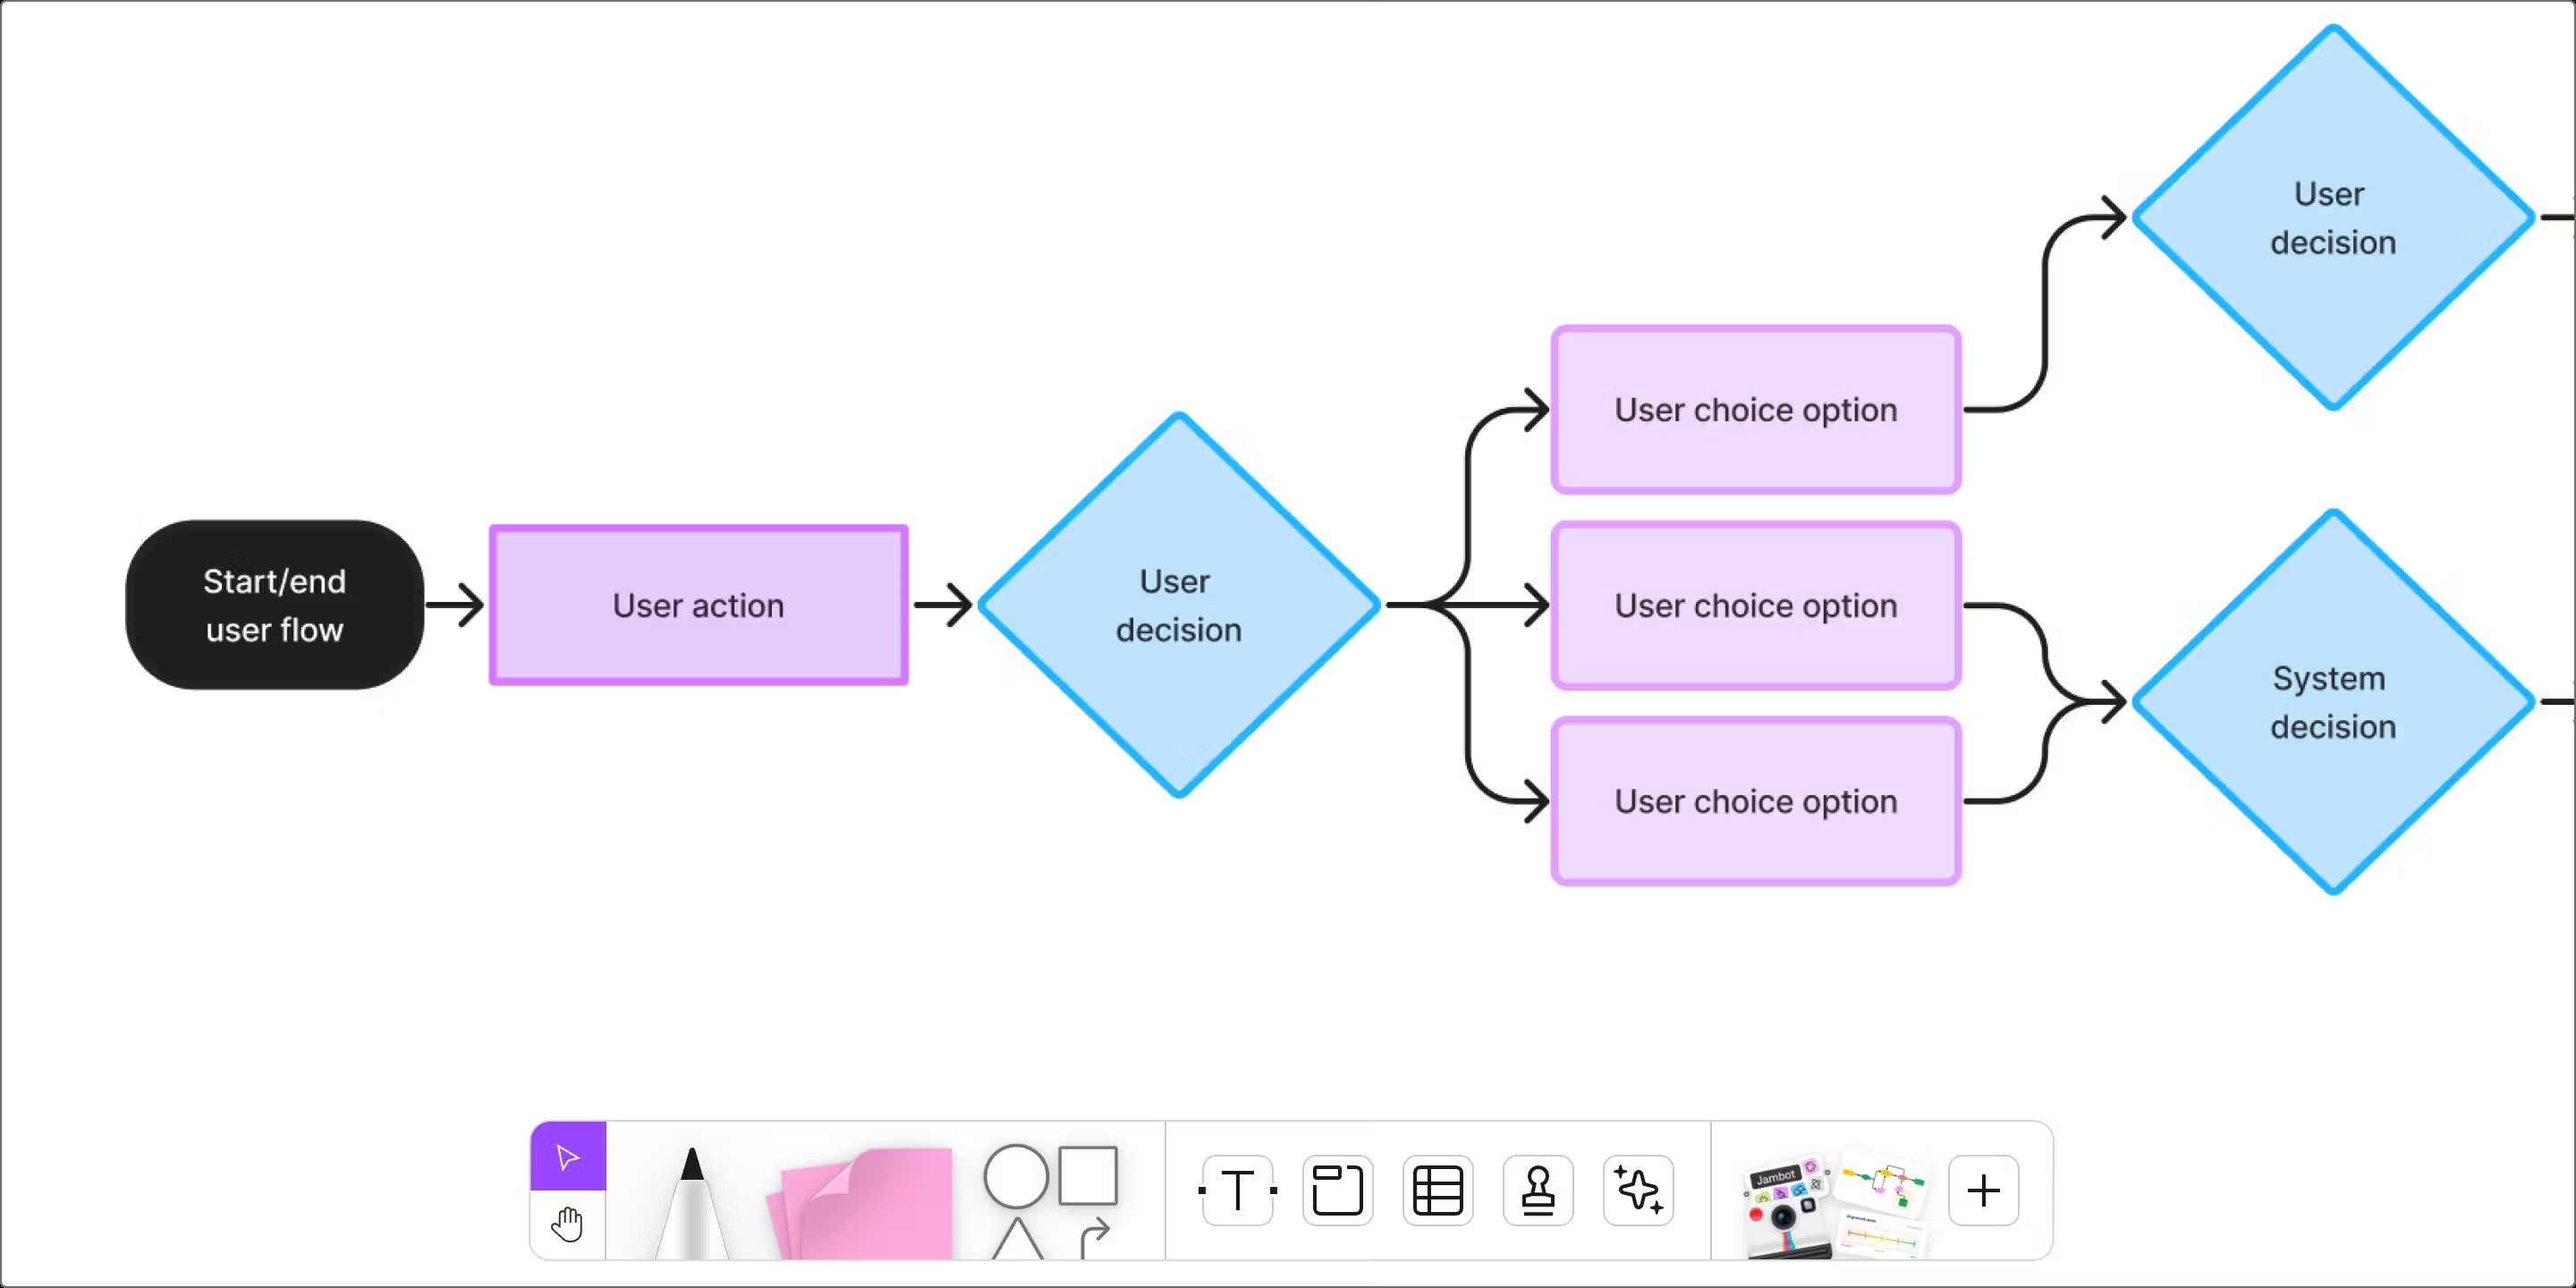
I created wireframes for 18 key screens, starting with low-fidelity sketches and iterating to mid-fidelity grayscale layouts. Each round incorporated feedback from internal reviews and 2 rounds of guerrilla usability testing.
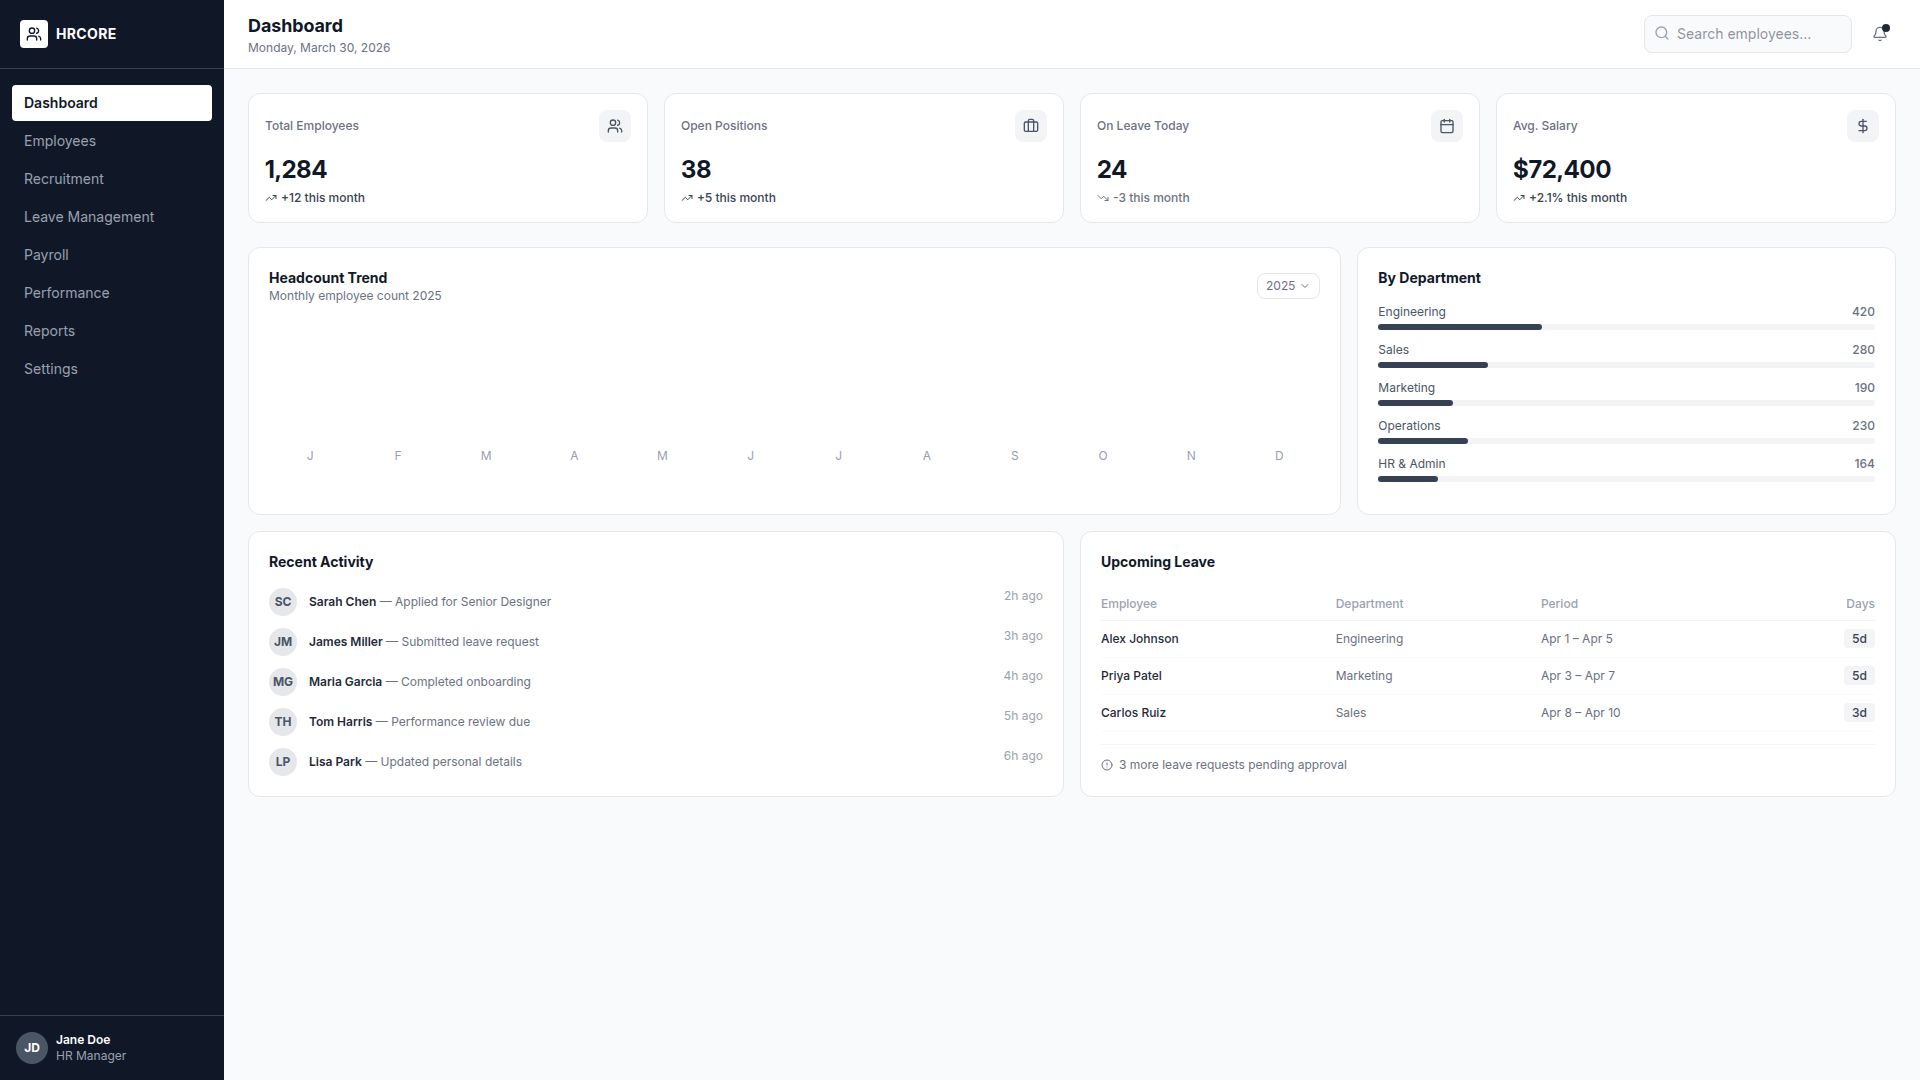
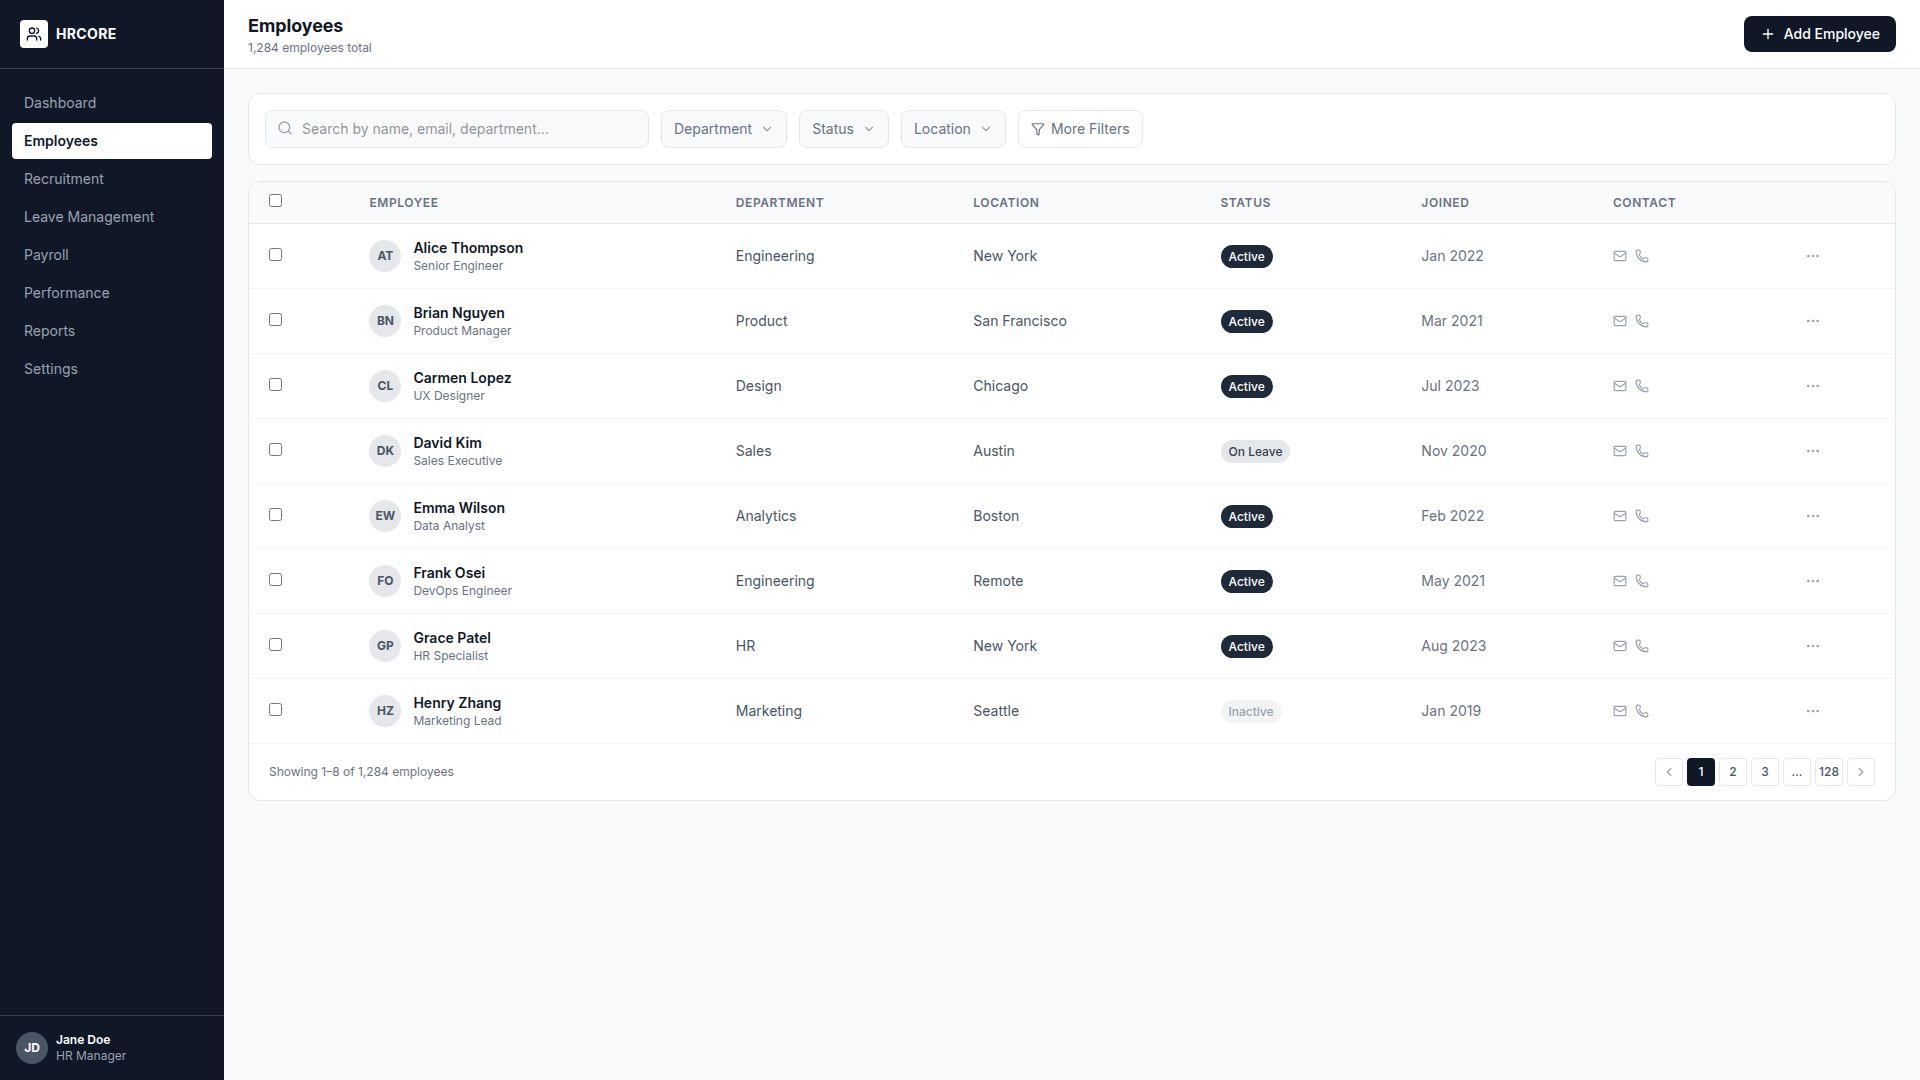
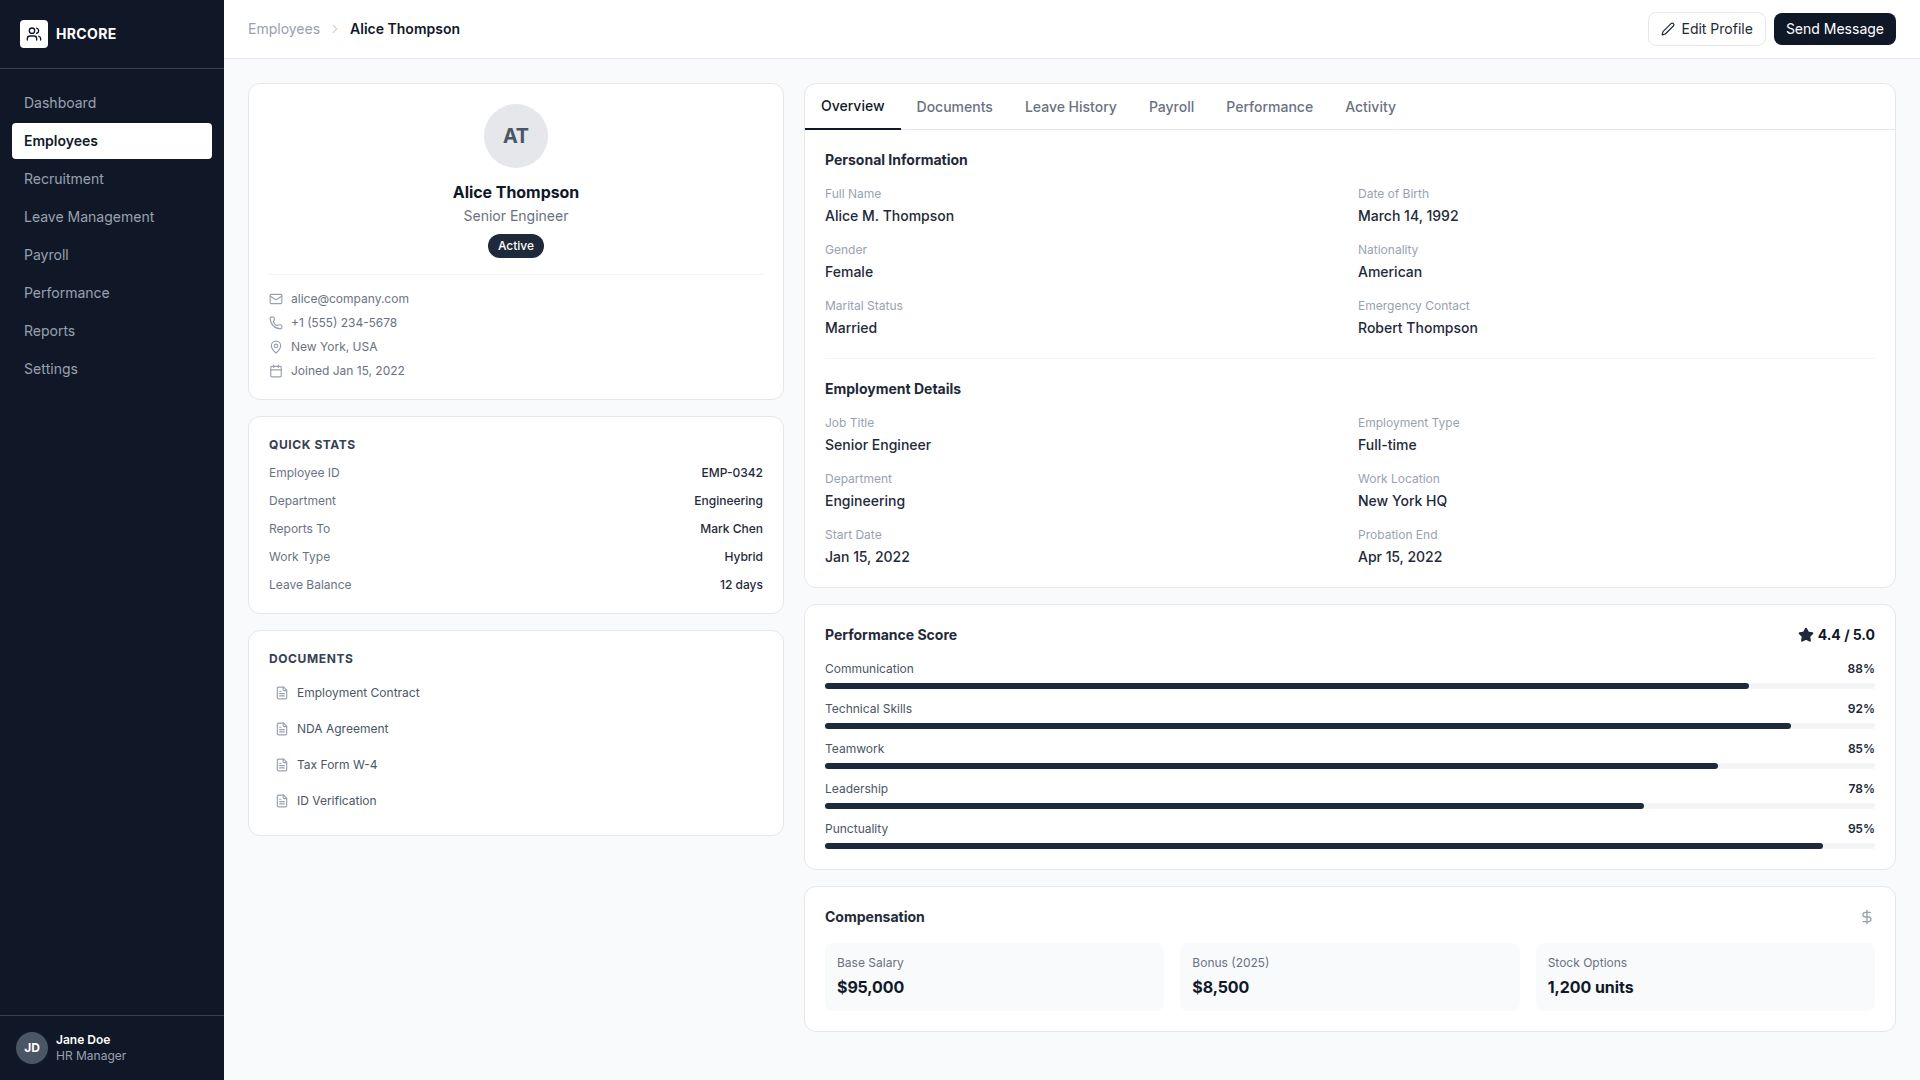
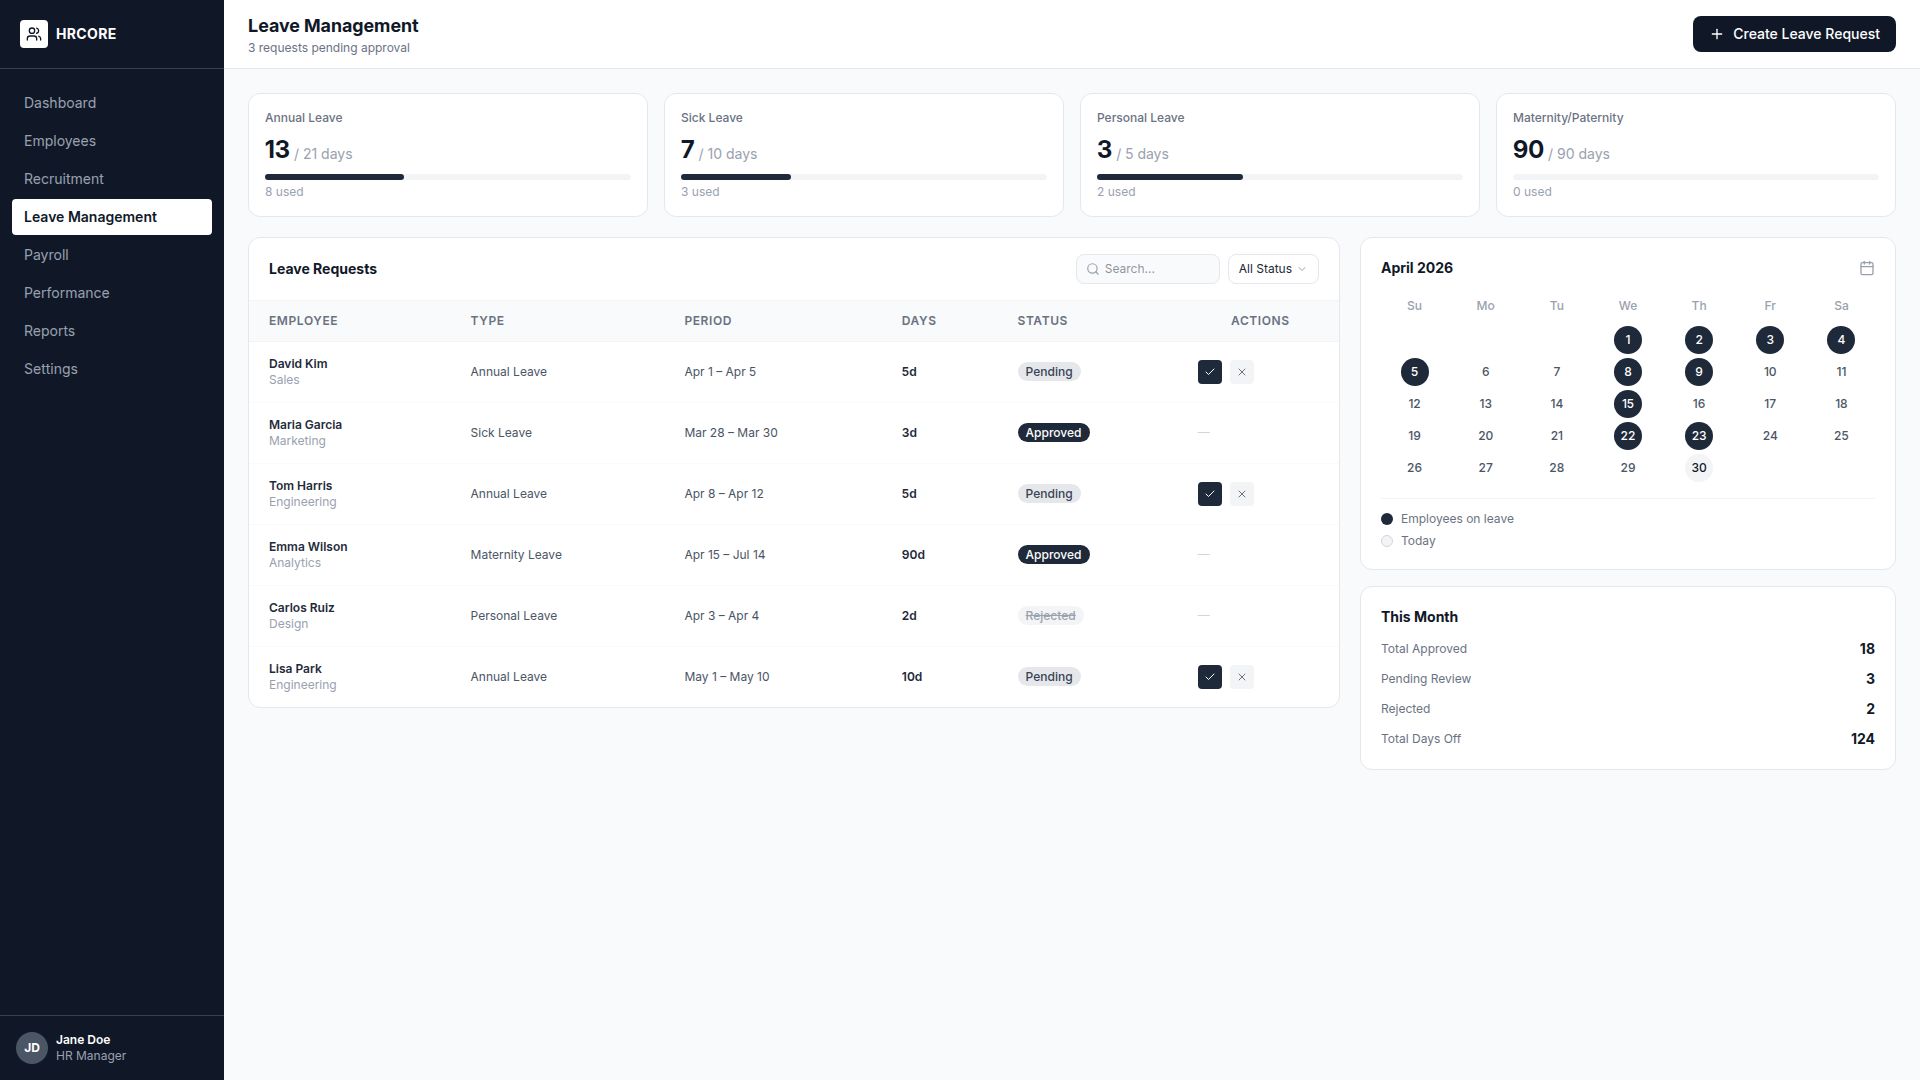
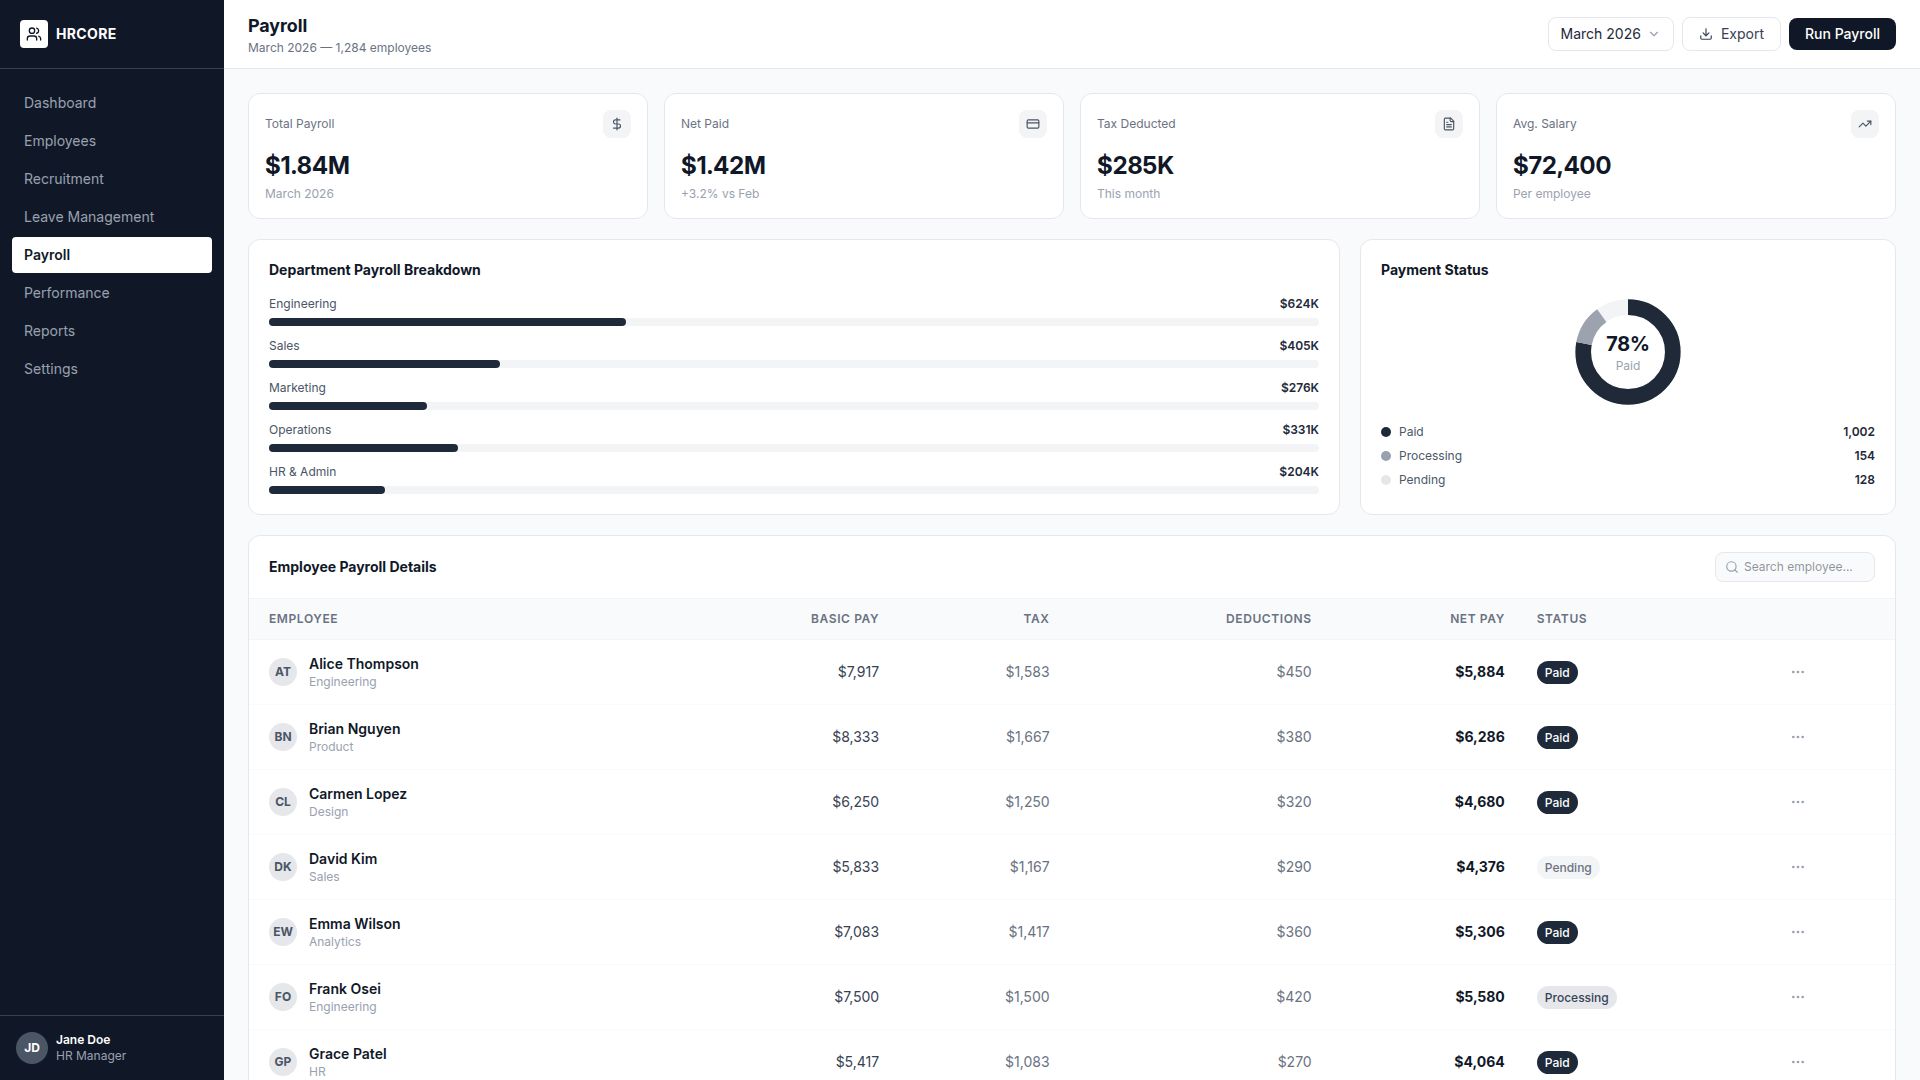
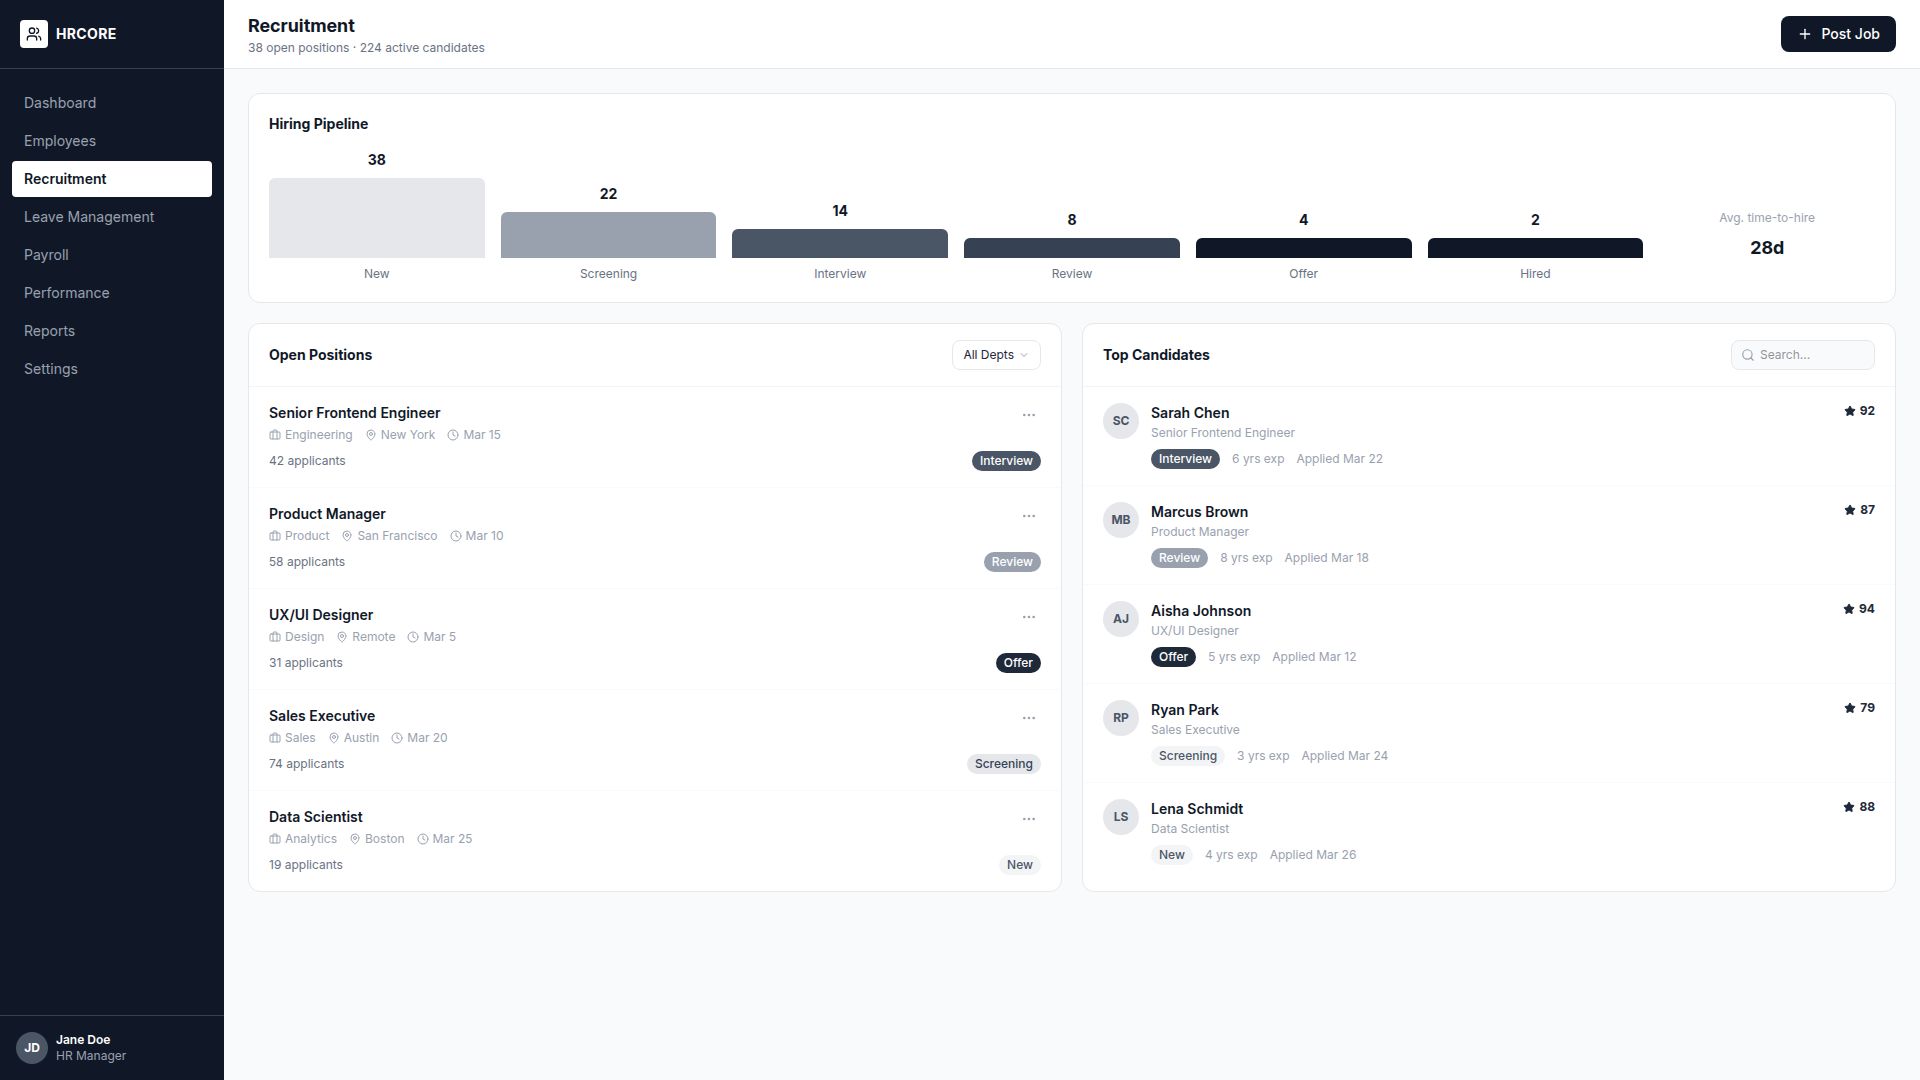
The final wireframes achieved a 92% task completion rate in usability tests, compared to 58% for the original design.
The visual design needed to balance professionalism (fintech) with approachability. I developed a clean, modern design system with a focused color palette and clear typography hierarchy.
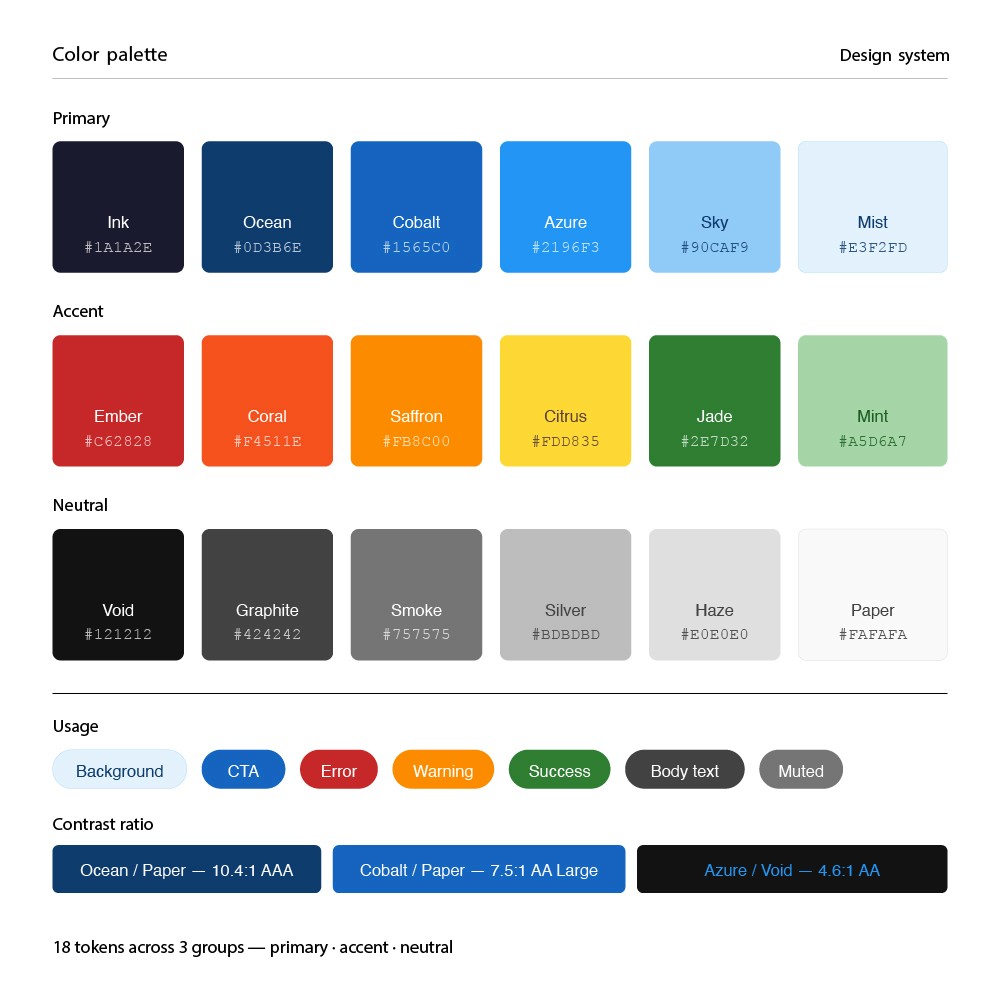
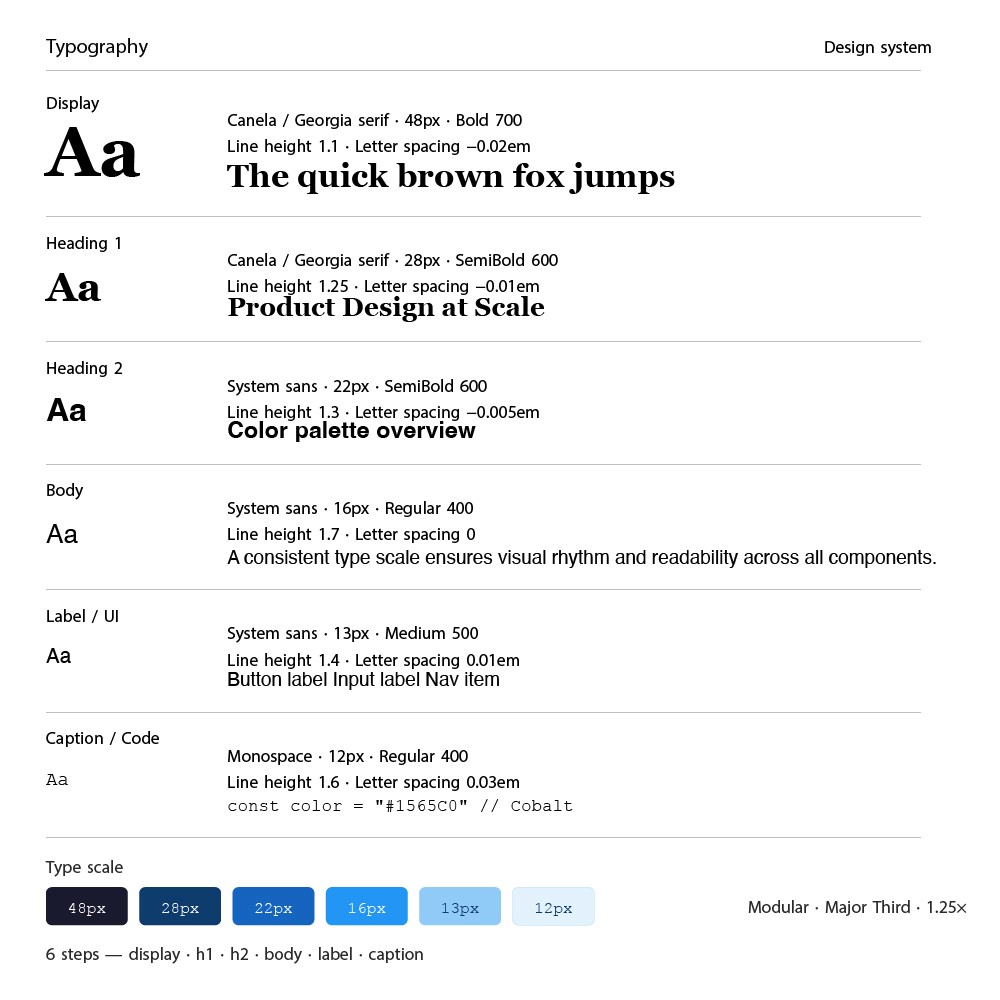
I built a high-fidelity interactive prototype in Figma and conducted 4 rounds of moderated usability testing with 24 participants using Maze for unmoderated sessions.
24
Test Participants
4
Testing Rounds
95%
Task Success Rate
Iteration 1: Simplified the payment creation flow — reduced from 5 fields to 3 with smart defaults. Result: 20% faster task completion.
Iteration 2: Redesigned the mobile experience — single column layout with larger touch targets and collapsible sections. Result: 35% increase in mobile task completion.
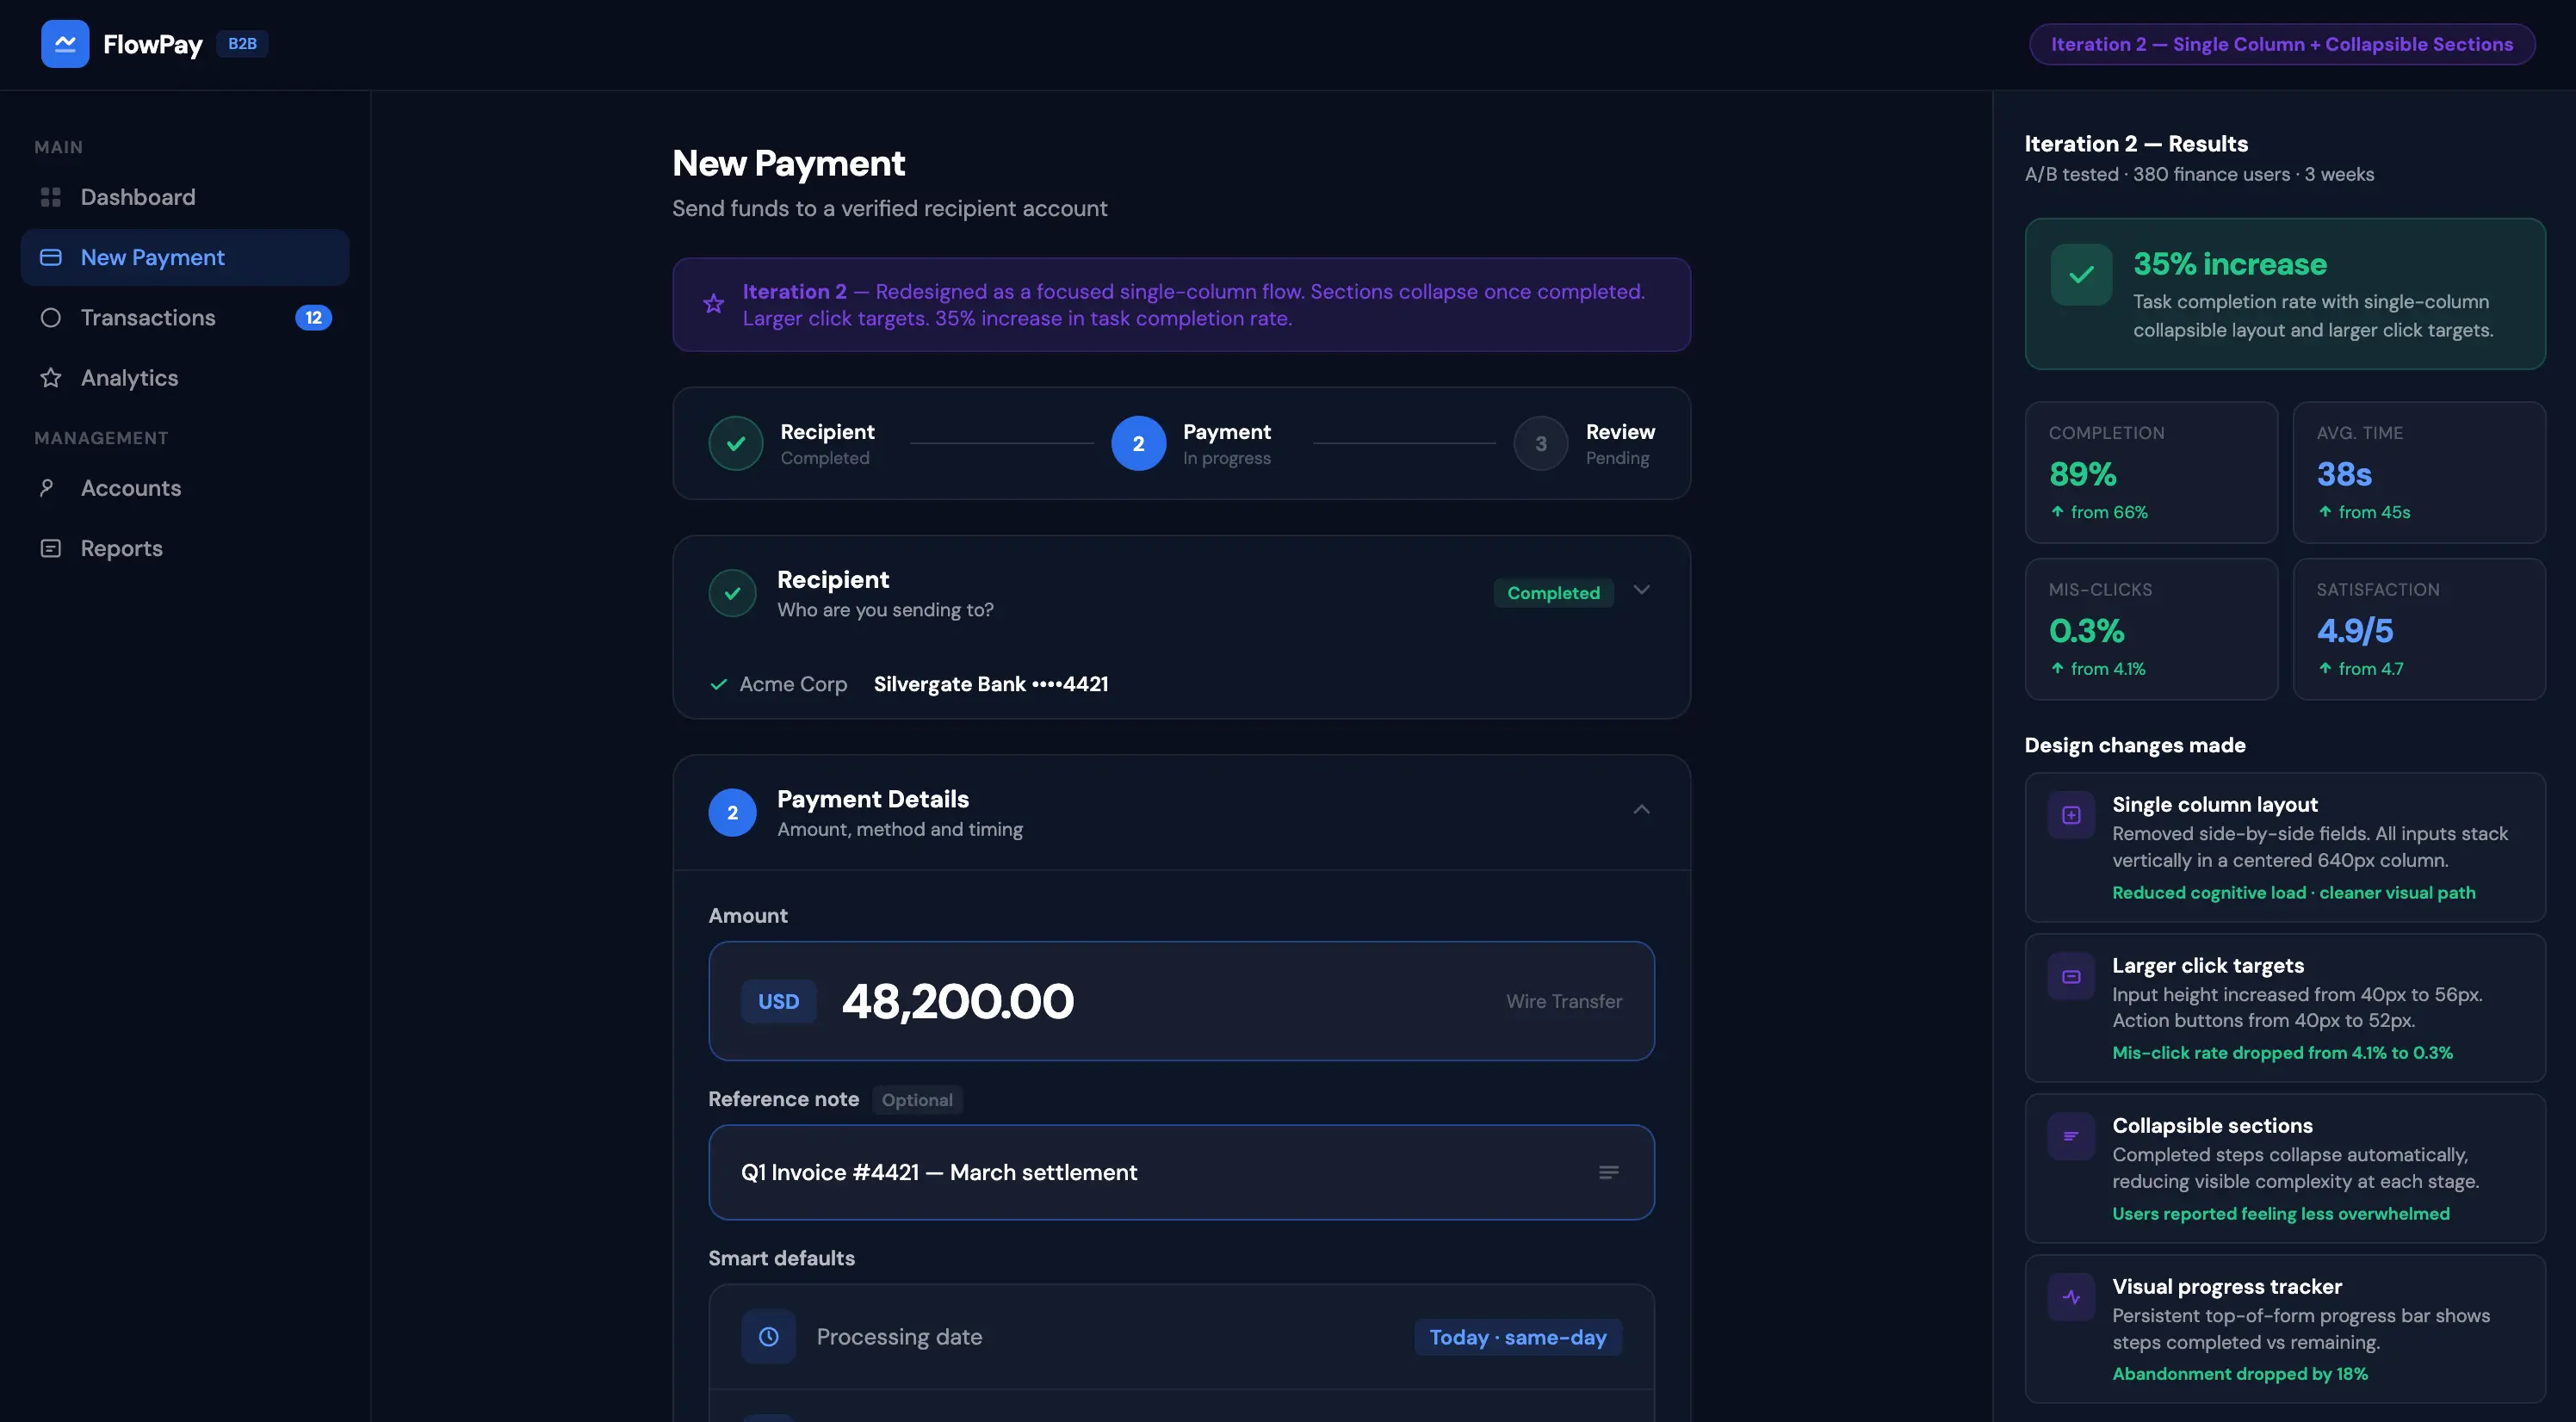
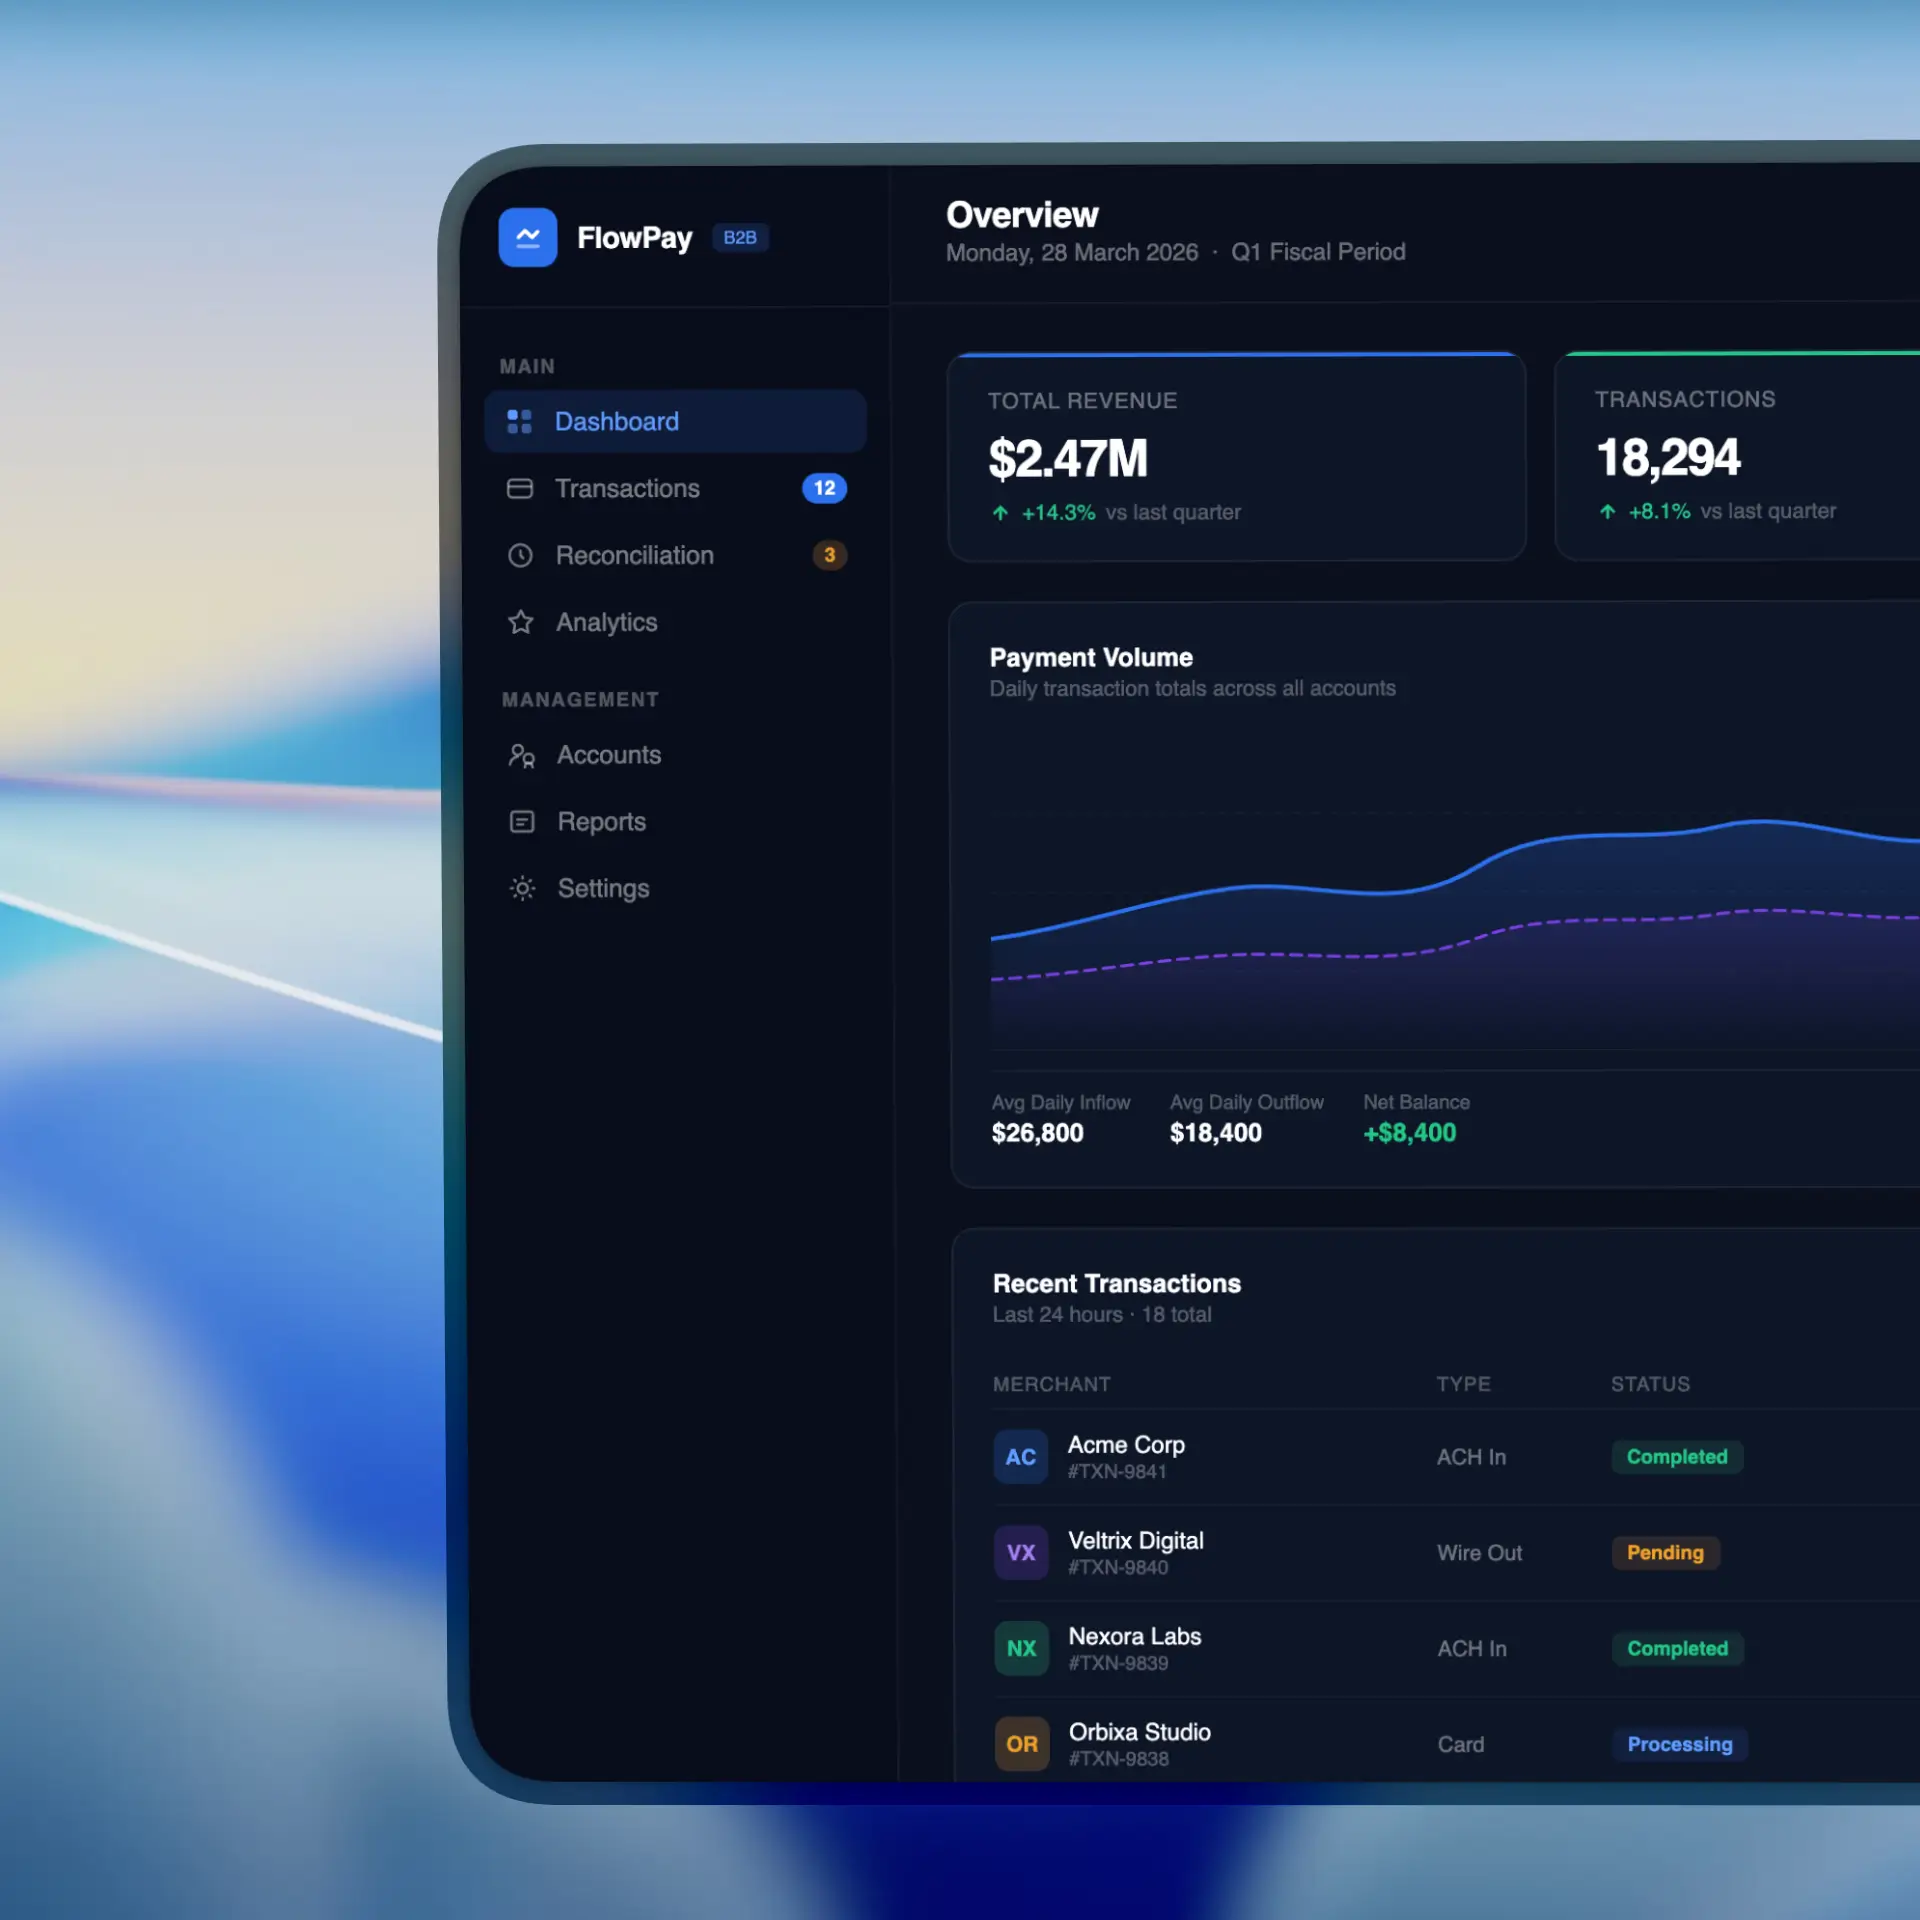
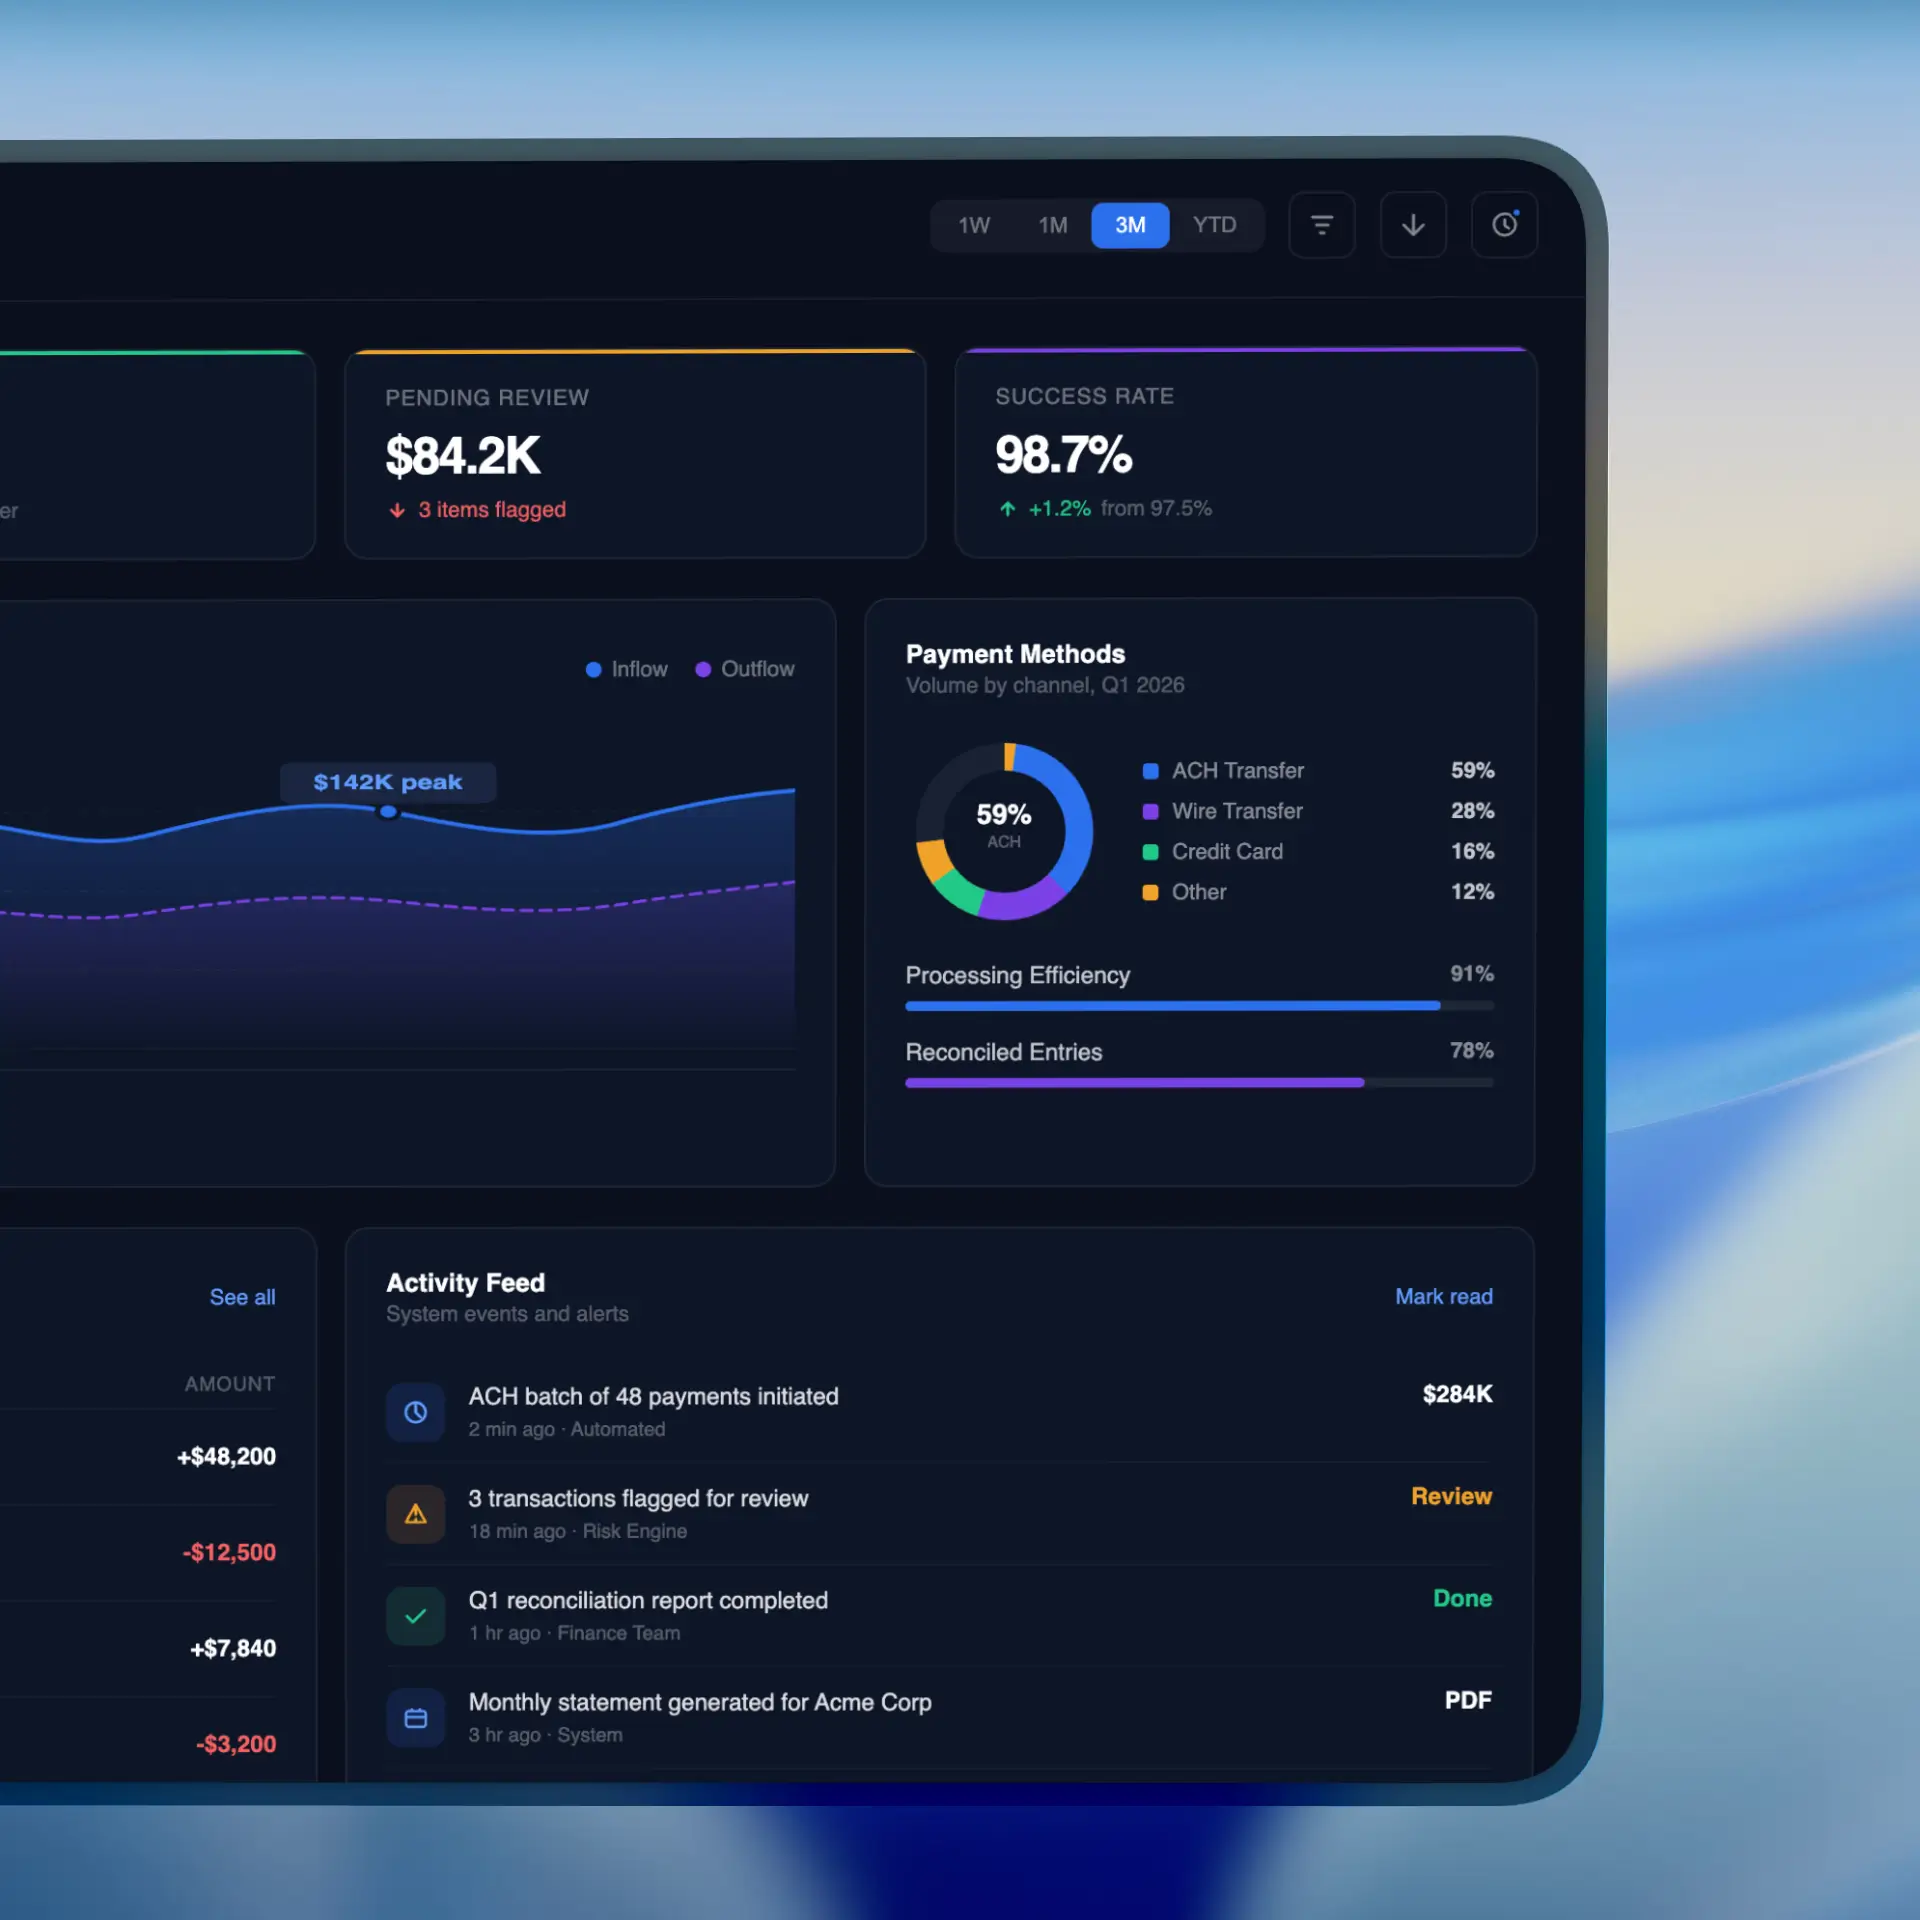
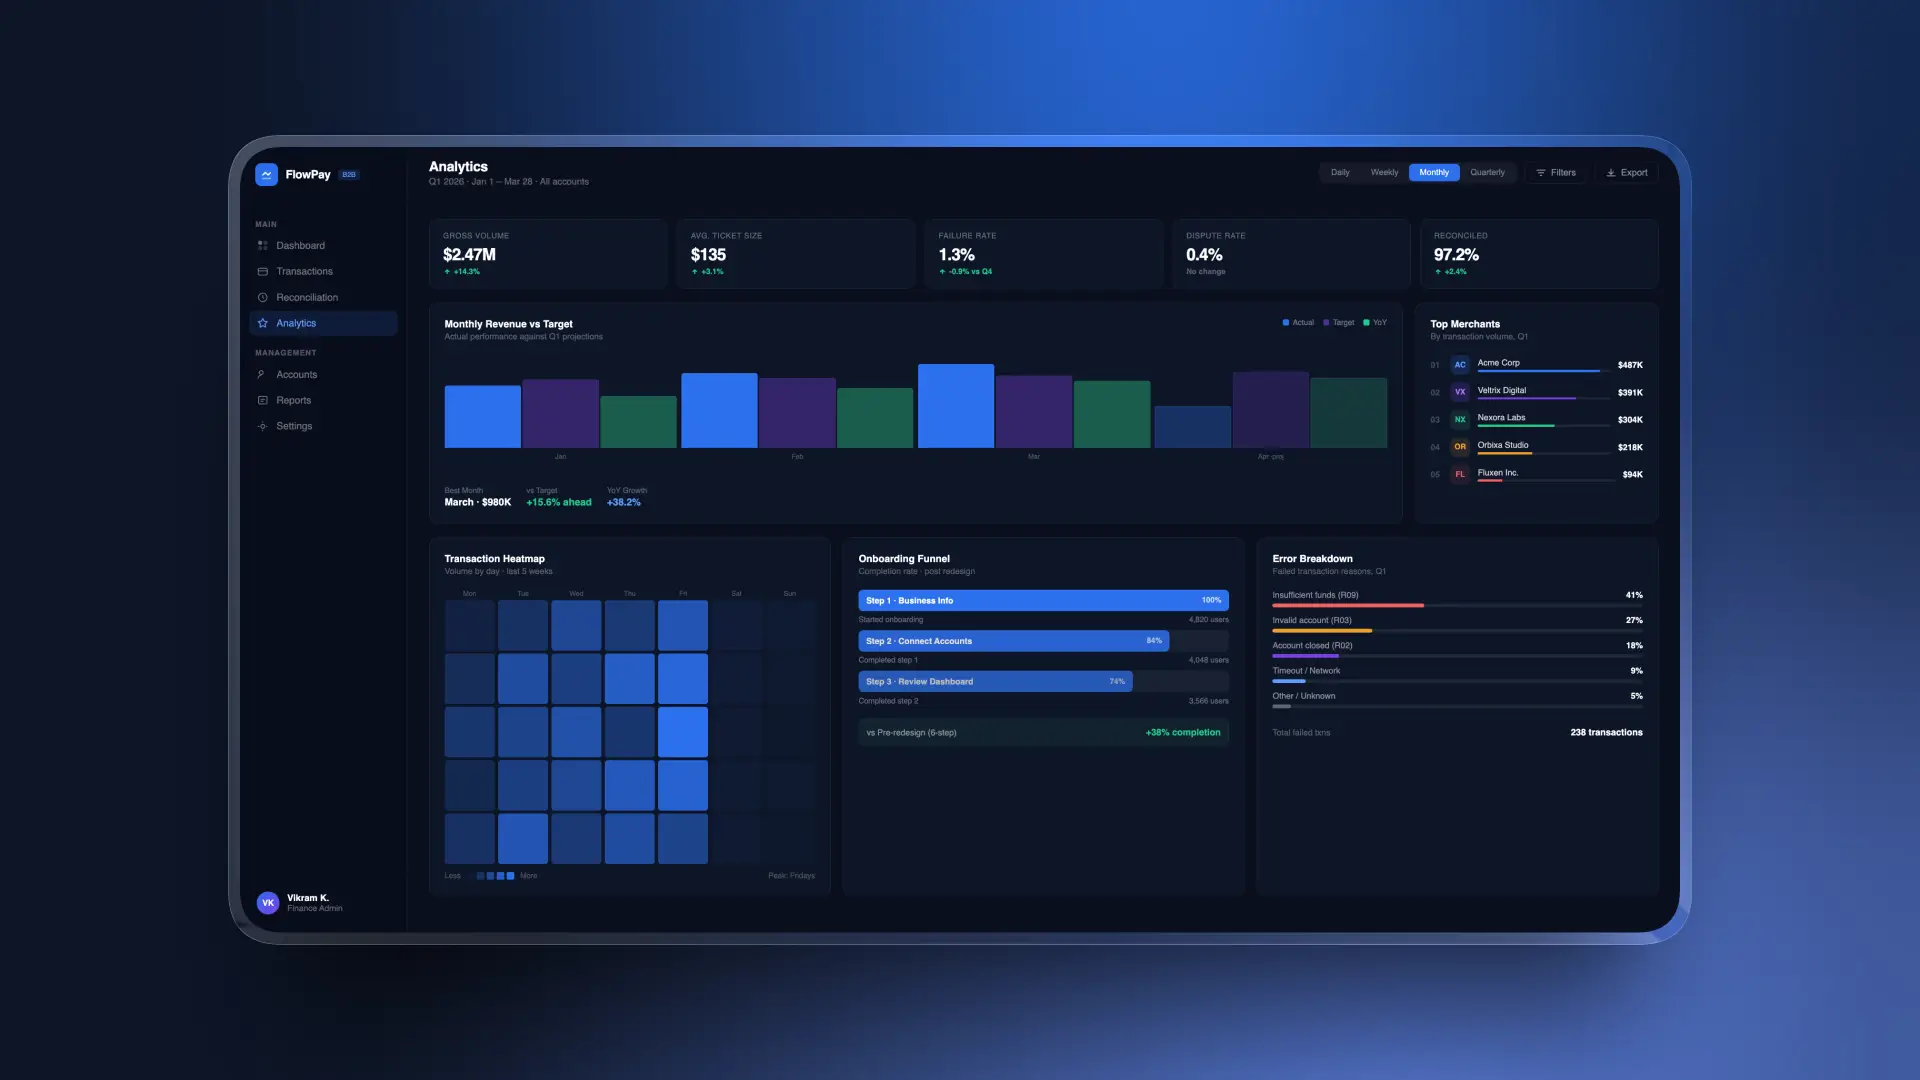
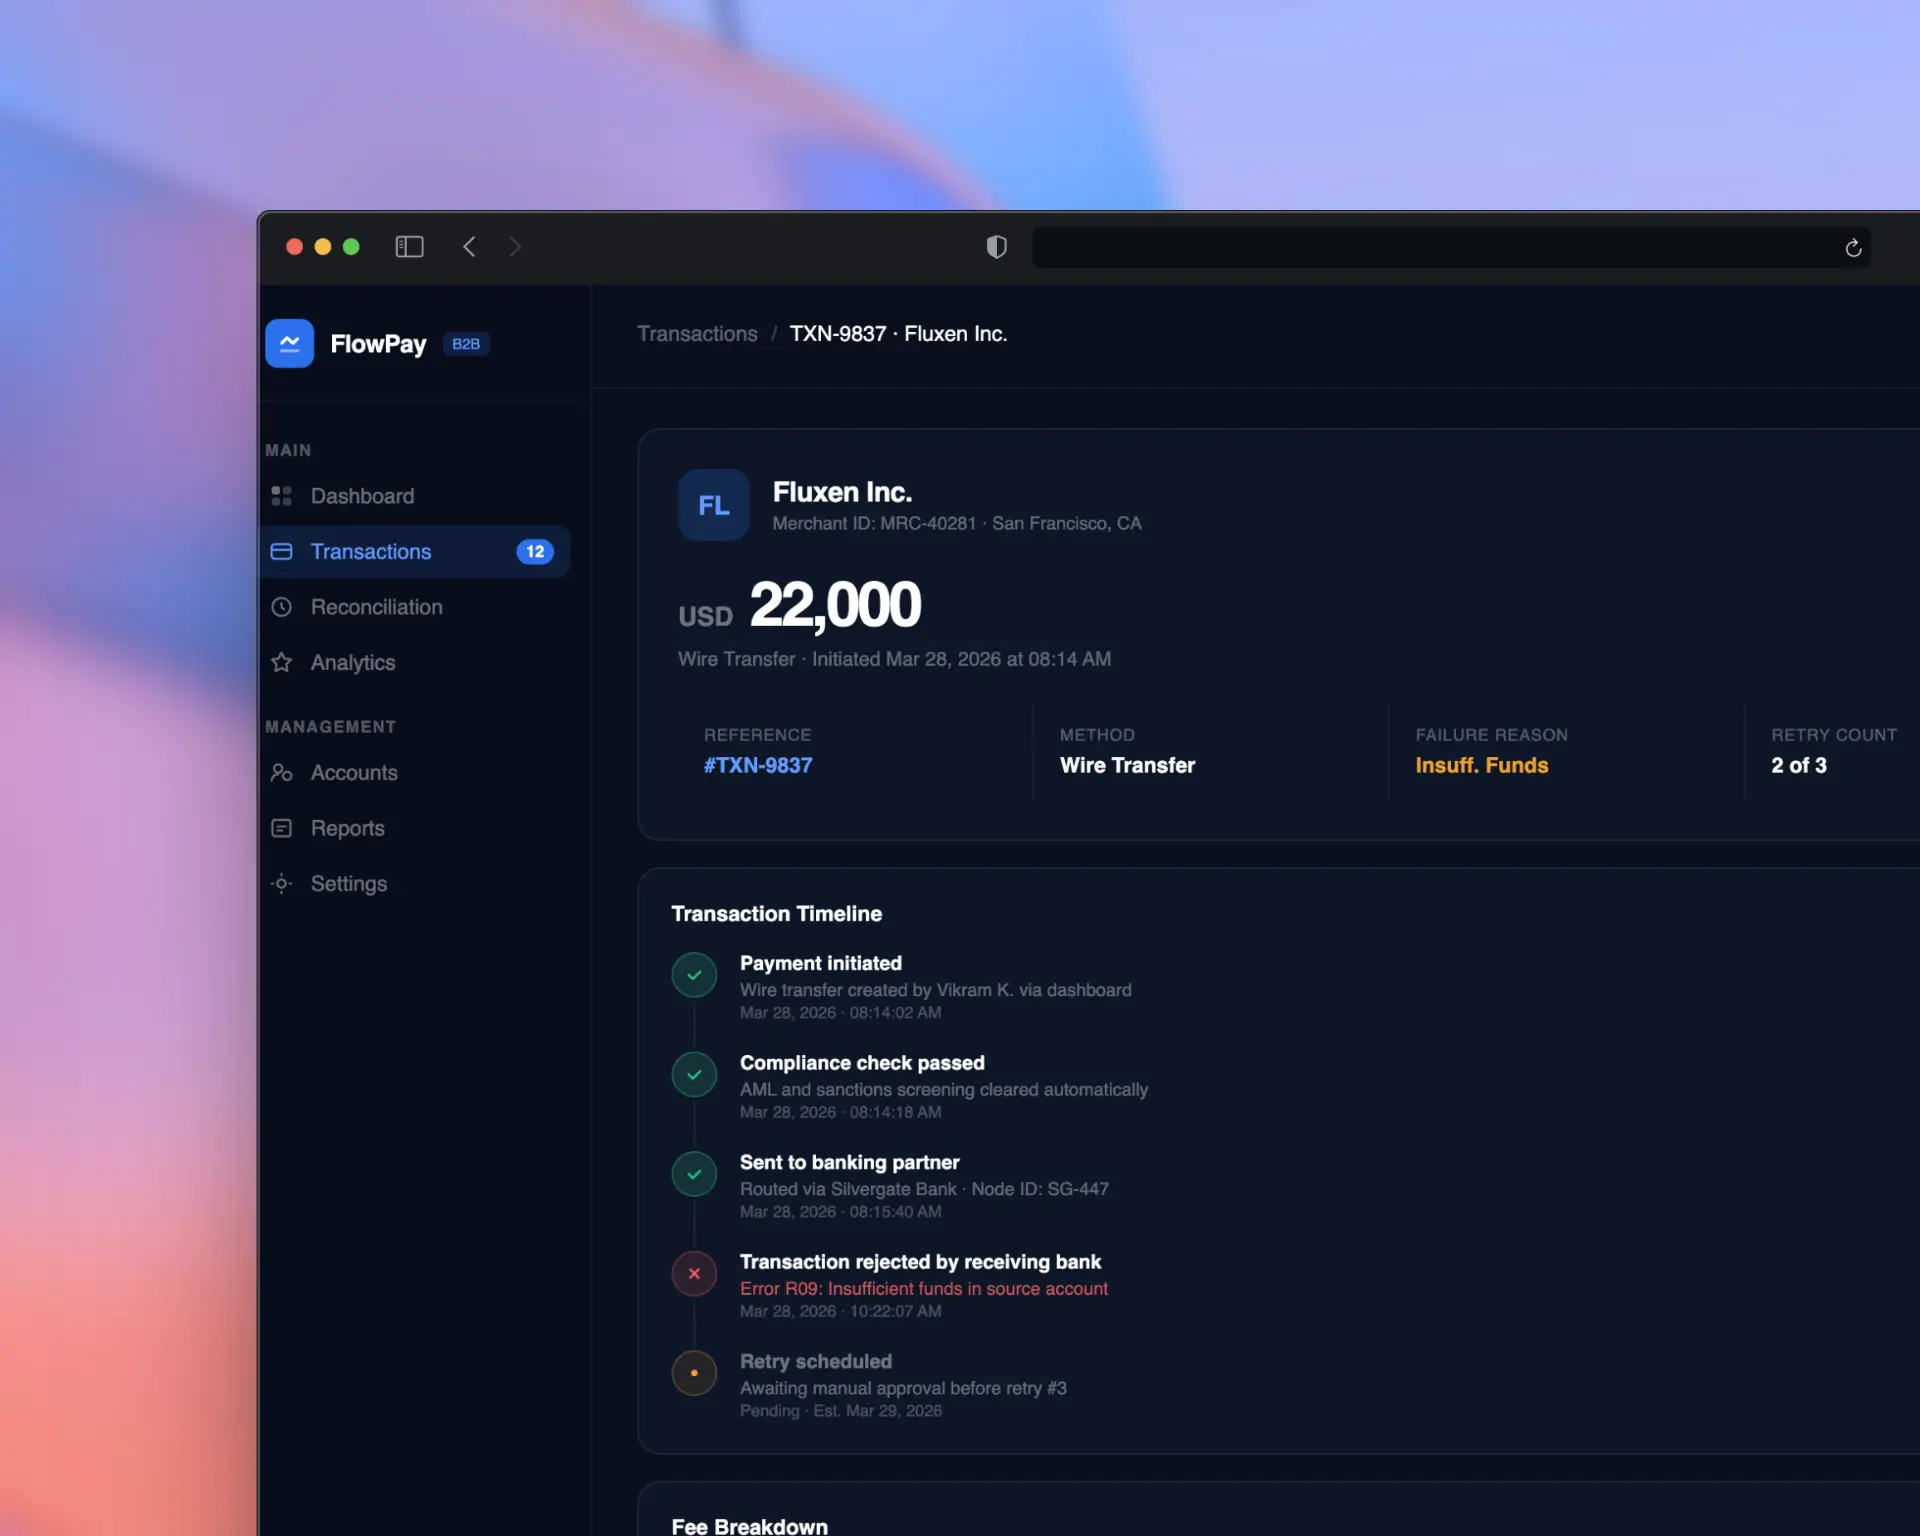
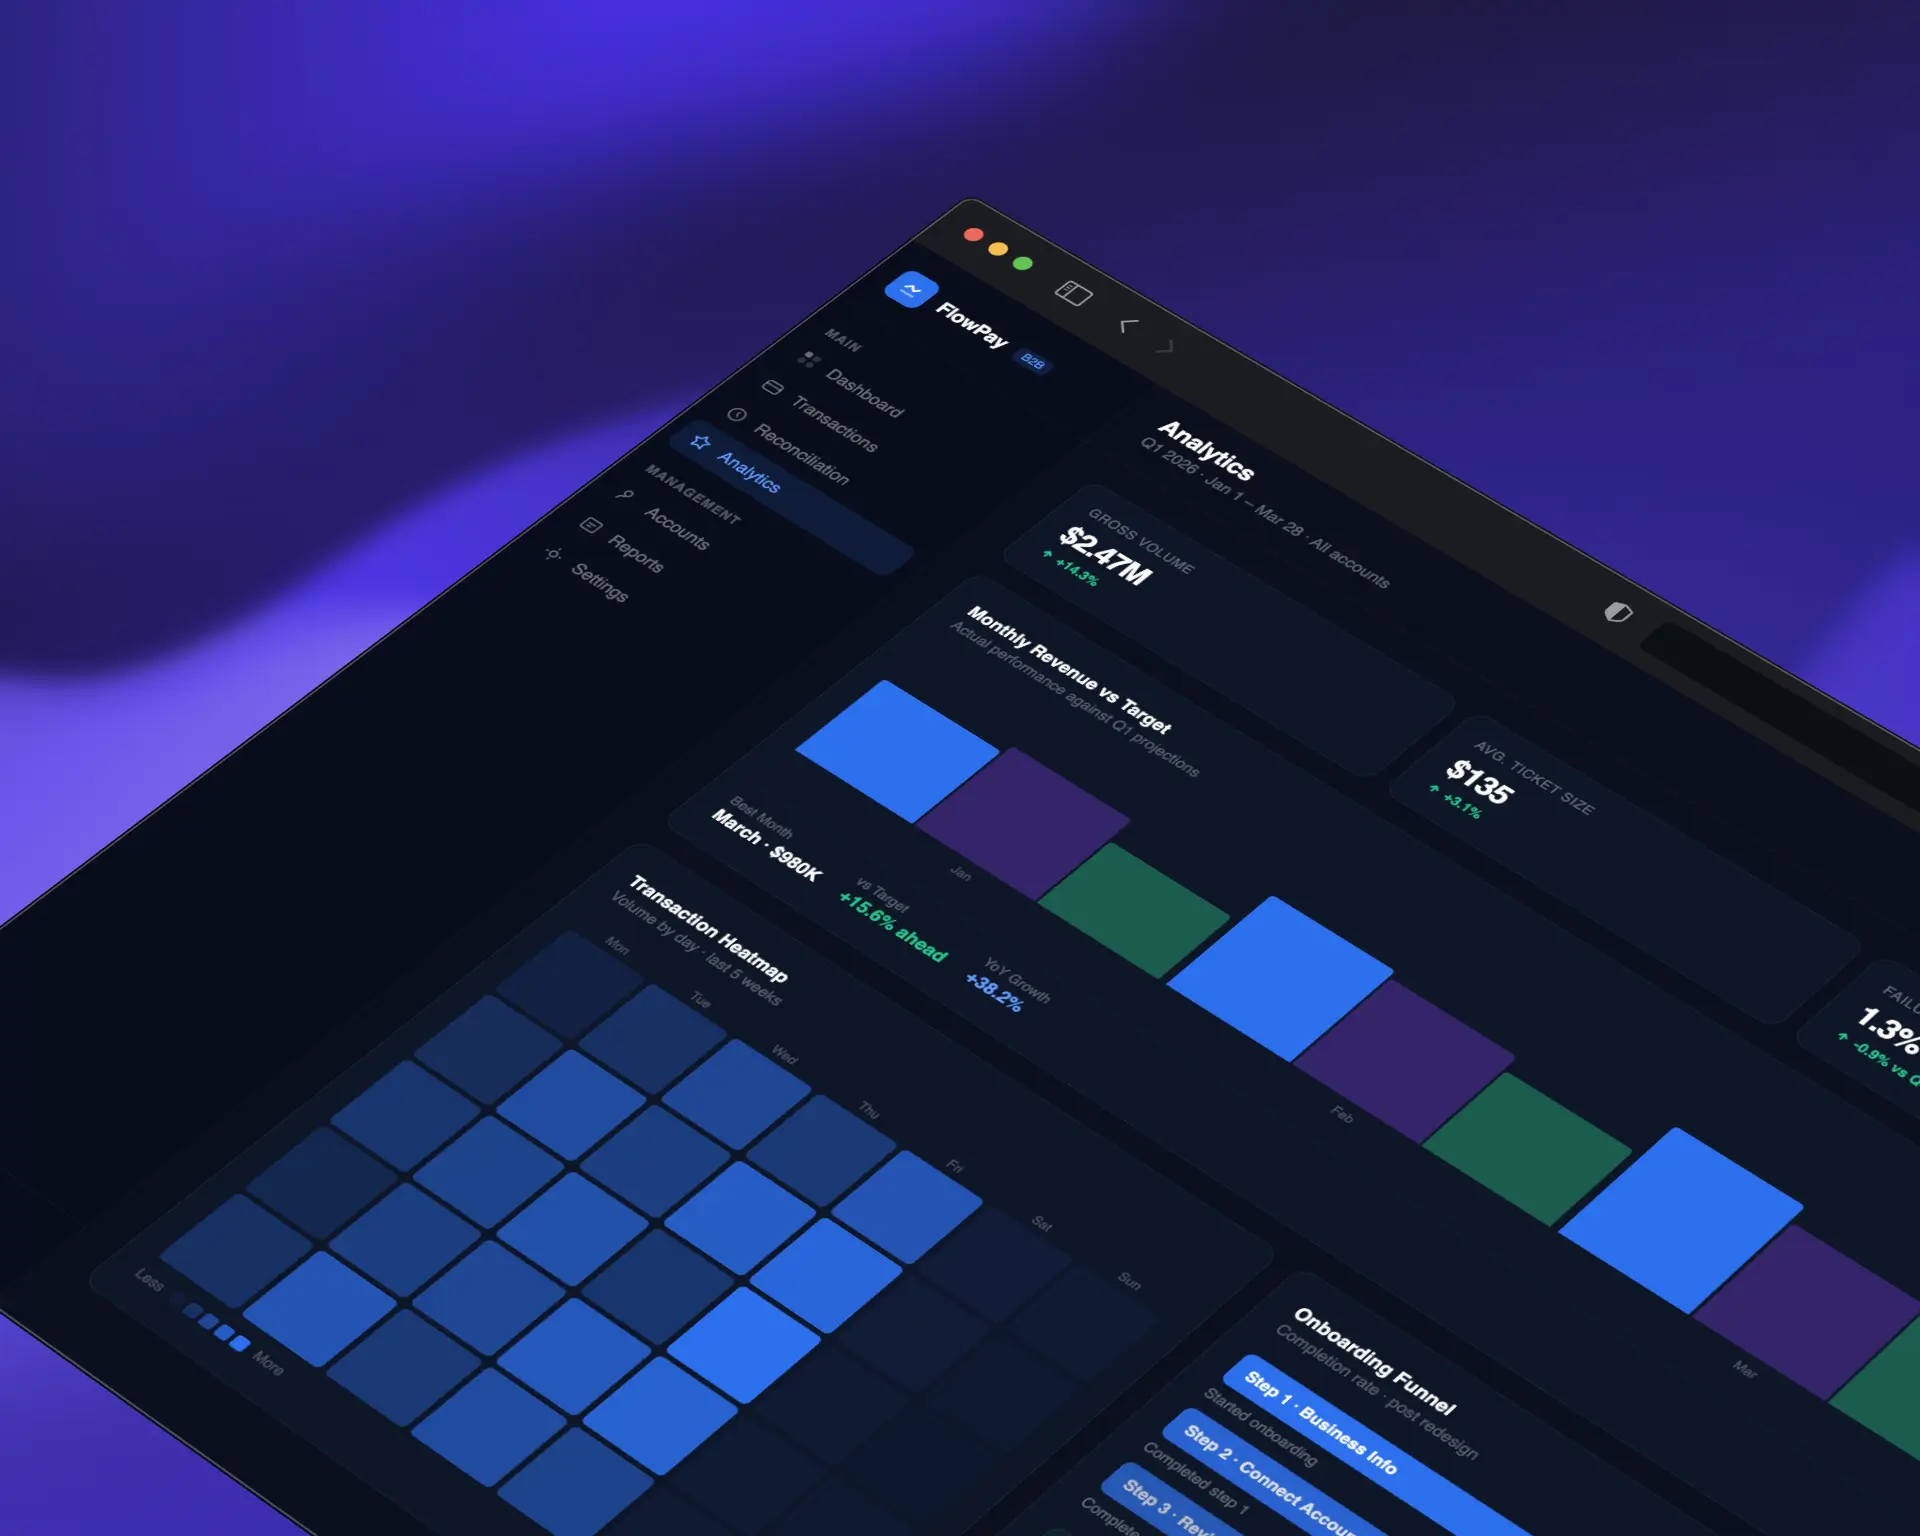
The final design, “StreamFlow,” delivers a clean, confidence-inspiring payment experience across all devices. Key features include
3-step guided payment flow with contextual help
Real-time transaction tracking with push notifications
Bulk payment processing for enterprise clients
Customizable reporting dashboard with export options
Dark mode support with full WCAG AA compliance
Mobile-first responsive design with gesture navigation
58%
NPS Improvement
25%
On boarding drop-off
10
Support Reduction
The redesign paid for itself within the first month. Our support tickets dropped by 60% and customer satisfaction has never been higher.
Early and frequent usability testing saves months of rework later
Fintech users prioritize trust and clarity over visual flair
Mobile-first doesn’t mean mobile-only — power users still need full desktop capabilities
Collaboration with developers early in the process leads to more feasible and innovative solutions
Implement AI-powered payment categorization and smart suggestions
Build out the design system into a shared component library
Expand analytics dashboard with predictive insights
Conduct longitudinal study to measure 6-month retention impact